Data Quality in Machine Learning: A Practical Framework for Production AI
A capture-measure-compare-gate framework for catching label noise, drift, leakage, imbalance, and stale eval sets before they quietly degrade a production ML or LLM system.
In this guide13 sections
At a glance
Data quality is not a single score you compute once and file away. It is a set of specific, row-level properties — correct labels, no leakage between training and evaluation, a distribution that still matches production traffic, and an eval set that still reflects what users actually do — that decay independently and silently. A model or agent can hold a stable accuracy number for months while the data underneath it degrades in ways that number was never designed to catch.
This guide is for the engineer, ML practitioner, or AI-ops owner responsible for a model or LLM-based agent already running in production, who needs a repeatable way to notice when the data has quietly stopped matching reality before an accuracy report says so.
| Before you start | What to define | What good looks like |
|---|---|---|
| A model or agent with a training set, an eval set, and live production traffic | Which of the five failure modes apply to your pipeline, and where each is measured | A repeatable check that catches decay in data, not just decay in the metric |
The operating model
Use Capture → Measure → Compare → Gate as the framework for this article. Capture means recording the input, label, and source of every row that enters training or evaluation. Measure means scoring each captured batch against the five failure modes below. Compare means checking that score against a defined baseline, not a fixed threshold in isolation. Gate means deciding, based on that comparison, whether a dataset or a release proceeds, warns, or blocks. The full picture is below in The Capture, Measure, Compare, Gate model.
Decision rule: If a model's accuracy or an agent's eval score is flat for more than one release cycle, do not treat that as proof of stability. Flat metrics on a fixed dataset and a healthy underlying data pipeline are two different claims, and this article is about verifying the second one.
This article is about data quality specifically — the properties of the rows a model trains and evaluates on. It does not cover general MLOps deployment pipelines or infrastructure reliability, and it does not duplicate AI agent drift detection, which covers behavioral drift in a running agent rather than defects in the datasets that feed it.
Why data quality outranks model quality in most production failures
Teams spend disproportionate effort tuning models, prompts, and retrieval configurations, and comparatively little verifying the data those systems learn from and are judged against. That balance is backwards for a simple reason: a well-tuned model trained or evaluated on bad data produces a confidently wrong answer, and a confidently wrong answer is harder to catch than an obviously broken one. A crashed API call gets noticed in minutes. A classifier trained on 8% mislabeled data can run for a year with nobody the wiser, because the model is doing exactly what it was told — learning the wrong pattern very well.
Bad data does not fail loudly; it fails convincingly. This is the core argument of this article: the failure modes below do not throw exceptions, do not show up as elevated error rates, and frequently do not move the aggregate metric a team is already watching. They require their own explicit checks.
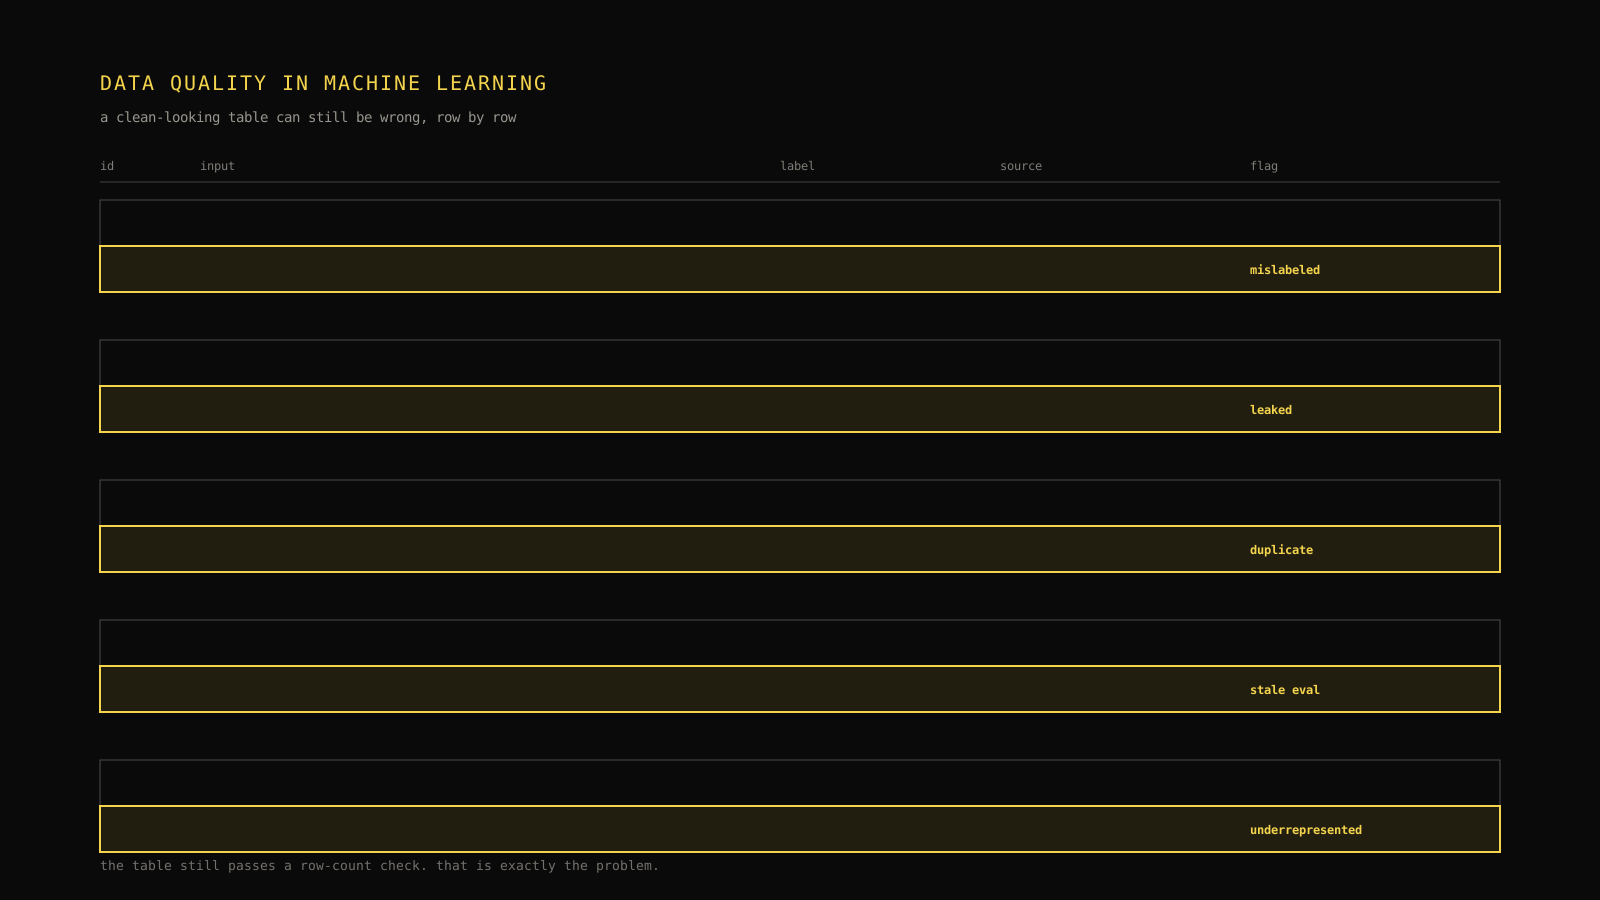
Five failure modes that quietly break data quality
Each of these degrades a system differently, and each requires a different check to catch. Treating "data quality" as one aggregate score hides which of the five is actually happening, the same way a blended accuracy number hides which customer segment is failing.
| Failure mode | What actually happens | Typical trigger | Where it hides |
|---|---|---|---|
| Label noise | A meaningful fraction of ground-truth labels are wrong | Rushed annotation, unclear labeling guidelines, annotator disagreement never resolved | Inside the labels themselves — the inputs look fine |
| Drift | The distribution of inputs, labels, or both shifts away from what the model was trained or evaluated on | Seasonality, new user segment, upstream schema or product change | Segment-level; aggregate metrics dilute it |
| Leakage | Information from the target, or from the evaluation set, is available to the model during training | Features computed after the fact, shared IDs between train/test splits, near-duplicate rows across splits | Inflated eval scores that collapse on truly new data |
| Class or scenario imbalance | Rare but important cases are underrepresented in training or eval data | Natural rarity of the case, sampling bias, an eval set built from convenient rather than representative data | The aggregate score, which is dominated by the majority case |
| Stale eval sets | The evaluation set no longer reflects current production traffic, product behavior, or user language | An eval set built once at launch and never revisited | A flat score that stops measuring what it once measured |
Label noise
Label noise is any ground-truth label that is wrong, ambiguous, or inconsistently applied. It is rarely uniform — a small set of confusing edge cases usually accounts for most of the disagreement, while the bulk of easy examples stay correctly labeled. That unevenness matters: a model can shrug off 2% random label noise spread evenly across easy cases, but the same 2% concentrated in one ambiguous category (a billing ticket that could be "refund" or "dispute," a support message that could be "bug" or "how-to") teaches the model exactly the wrong boundary for the case it will struggle with most in production.
The most reliable signal for label noise is inter-annotator disagreement: when two independent labelers disagree on a meaningful fraction of a sample, the guidelines or the category boundary — not just one annotator — usually need work. A single annotator's confidence is not evidence; agreement between independent annotators is.
Drift
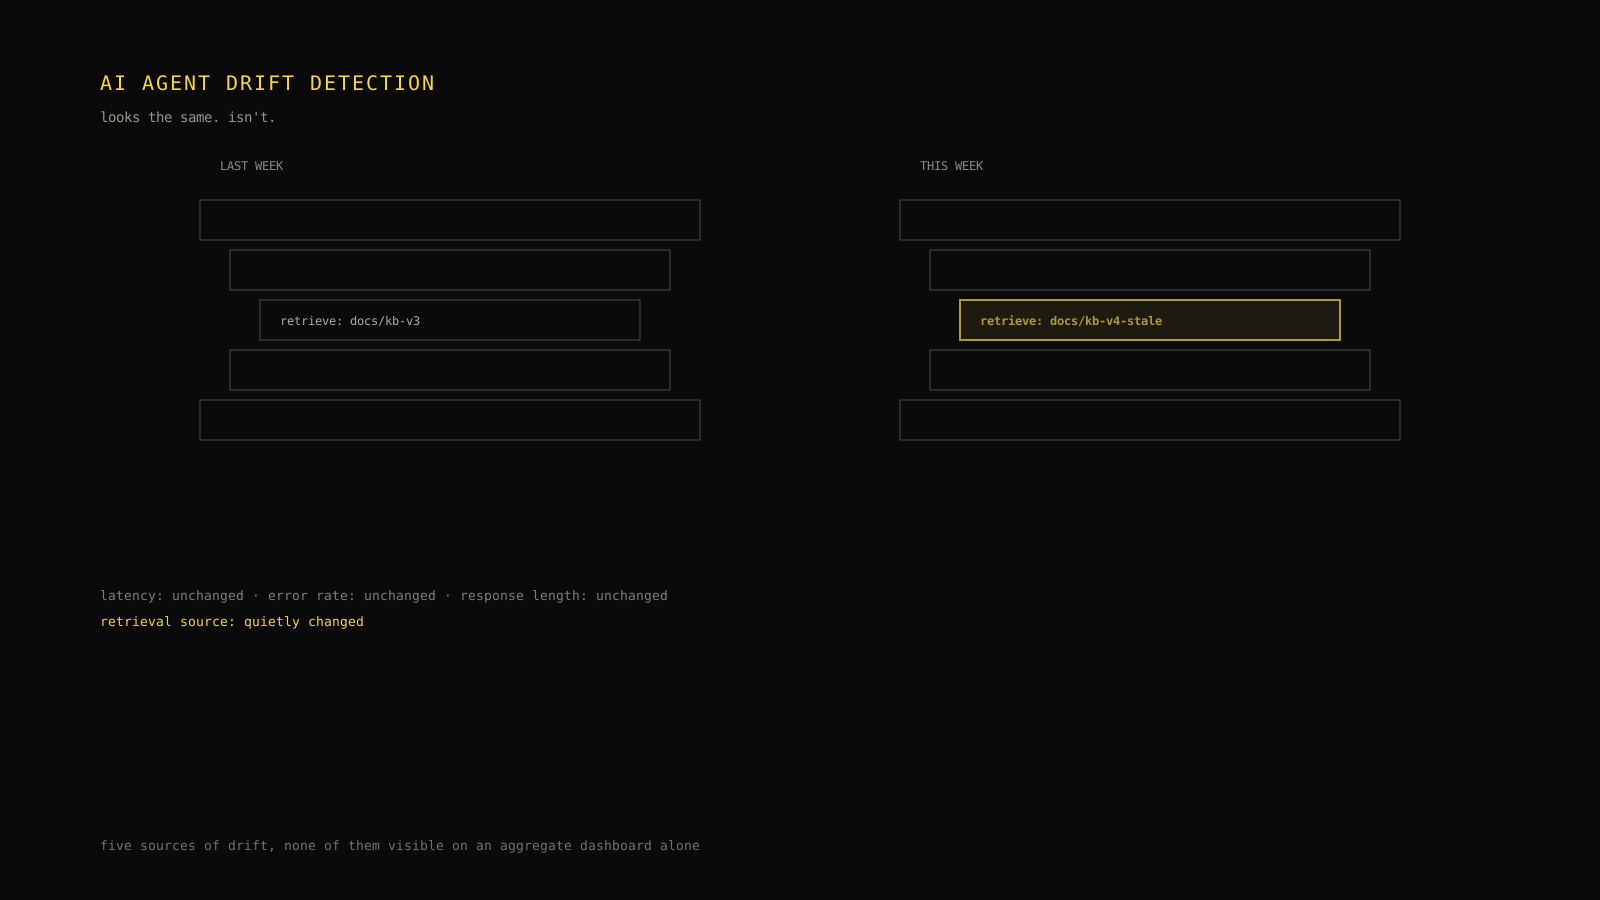
Drift, covered in more depth in AI agent drift detection, is a persistent shift in the distribution of inputs, labels, or the relationship between them. In a data-quality context specifically, the concern is narrower than agent behavior drift: does the data currently used for training or evaluation still resemble the data the system sees in production right now? A fraud model trained on last year's transaction patterns, or a support classifier evaluated against last year's ticket categories, can degrade purely because the world moved and the dataset didn't.
Leakage
Leakage happens when information that would not be available at prediction time ends up influencing training or, more dangerously, ends up in both the training and evaluation splits. The second form is the more common trap: near-duplicate rows, shared entity IDs, or overlapping time windows between train and test sets let a model "memorize" its way to a high eval score without generalizing at all. A model can pass its own eval set almost entirely because the eval set already leaked into training. This is why an eval score that looks unusually good relative to the difficulty of the task deserves suspicion rather than celebration.
Class or scenario imbalance
Every production system has cases that occur rarely but matter disproportionately — the payment failure that costs a customer, the prompt injection attempt, the safety-critical edge case. A training or eval set that samples "naturally," without deliberately ensuring these rare cases appear in sufficient numbers, will let a model perform excellently on the common case while being effectively untested on the case that actually determines whether the system is trustworthy. An aggregate accuracy score dominated by 95% common-case traffic can stay high even if the model gets every rare case wrong, because the rare cases are too few to move the average.
Stale eval sets
This is the failure mode from the opening scenario, and it is the one teams check for least often, because a stale eval set does not look broken — it keeps producing a number, and the number looks stable. The problem is that "stable" and "still measuring the right thing" are different claims. An eval set built once, at launch, against the traffic and product behavior of that moment, slowly stops representing current reality as the product, the user base, and the language they use all continue to change. A flat eval score on a stale eval set is not evidence of stability — it is evidence that the test stopped changing, which is a different fact entirely.
The Capture, Measure, Compare, Gate model

The four stages give each failure mode a concrete home instead of leaving "data quality" as a vague aspiration.
Capture. Record, for every row that enters training or evaluation, its input, its label, its source, and a timestamp. Without this, none of the later stages have anything to compare against. This is the same discipline that makes trace-based observability useful for running agents — you cannot measure a change you never recorded a baseline for.
Measure. Score each new batch of data against the five failure modes: an annotator-agreement sample for label noise, a distribution comparison for drift, a duplicate/overlap check for leakage, a per-category count for imbalance, and a recency and coverage check for eval staleness. Each of these is a separate, specific check — not one composite "data health score" that hides which failure mode fired.
Compare. Check the measurement against a recorded baseline, not a hardcoded pass/fail threshold applied in isolation. A drift score of 0.15 means nothing without knowing what a normal week looks like for that same pipeline; a fixed threshold set once at launch will eventually be either too strict for normal seasonal variance or too loose for a real regression.
Gate. Decide what happens next: pass silently, warn a data owner, or block the training run or the release. Not every finding deserves a hard block — a small increase in label disagreement on a genuinely ambiguous category might warrant a guideline review rather than stopping a pipeline. Reserve hard gates for the failure modes with the clearest evidence and the highest cost of being wrong, such as confirmed train/eval leakage.
Field note: Version the dataset the same way you would version a model or a prompt. "We checked data quality" is not a reproducible claim unless you can say which snapshot of which dataset was checked, and when.
Measuring each failure mode with concrete signals
Turning the model above into practice means picking one or two measurable signals per failure mode, rather than trying to build one universal score.
Illustrative measurement checklist by failure mode:
- [ ] Label noise: sample 100–300 rows, have two independent annotators re-label them blind, and compute agreement. Below roughly 85% agreement on a category signals a guideline problem, not just noisy annotators.
- [ ] Drift: compare the distribution of input features (or, for text, embedding or vocabulary distribution) between the training window and the most recent production window. A meaningful shift in shape — not just the mean — is the signal to chase.
- [ ] Leakage: check for exact and near-duplicate rows across train/eval splits, and check whether any feature was computed using information that would not exist at prediction time.
- [ ] Imbalance: count rows per category or scenario against a minimum viable sample size for that category, not just against the total dataset size.
- [ ] Stale eval sets: track the eval set's last-updated date and compare its category and vocabulary distribution against a fresh sample of current production traffic.
None of these checks require a labeled ground-truth dataset for every production run — they compare distributions and samples, the same proxy-signal approach that works for detecting behavioral drift in a running agent.
Worked example: a stale eval set masking a real regression
Return to the opening scenario. A support-ticket classifier has held 94% accuracy on its eval set for six months. The eval set was built at launch from 200 real tickets, hand-labeled once, and has not been touched since. Three months ago, the company changed its refund policy, which changed both the volume and the vocabulary of billing-related tickets — customers now ask about "partial credits" and "policy exceptions," phrases that do not appear anywhere in the original 200-ticket eval set.
The eval score stays at 94% every release, because the eval set is still asking the same 200 questions it always asked, and the model still answers those particular 200 questions correctly. Applying the checklist above: a fresh sample of 200 current production tickets, labeled the same way, scores 71% — the classifier is now regularly misrouting billing tickets that use the new vocabulary, and nothing in the standing eval set could have shown that, because none of its cases use that vocabulary.

The fix here is not a model change. It is refreshing the eval set with a current, representative sample and re-running both scores side by side going forward. The gap between the two numbers is the actual finding — not either number in isolation.
Connecting data quality to eval and observability pipelines
Data quality checks are most useful when they are not a separate, occasional audit but a routine step inside the same pipeline that runs evaluations and monitors production behavior. Three connections matter most for an agentic or LLM-based system.
Eval sets need the same staleness check as training data
Teams that would never train a model on year-old data often keep an eval set frozen for a year without noticing the inconsistency. An eval set is data too, and it decays the same way. Treat "when was this eval set last refreshed against current production traffic" as a tracked property of the eval set itself, not an afterthought. This connects directly to periodic eval-sample methodology covered in RAG evaluation and to metric selection in AI evaluation metrics — a well-chosen metric computed against a stale eval set still produces a misleading number.
Observability traces are a live data quality signal
A production trace — the retrieved sources, the tool calls, the final answer — is itself a data point that can be checked for the same failure modes a training set can: does this trace's outcome match the label a human would assign it (label noise, applied to production judgments), does the distribution of retrieved sources look like the training-time distribution (drift), and is this exact input a near-duplicate of something already in the eval set (leakage, in reverse — eval set into production rather than production into eval). Treating live traces as a rolling, ungoverned dataset — rather than only a debugging tool — turns observability into an early-warning system for data quality decay, not just for uptime and latency.
Gate releases on data quality, not only on model metrics
A release checklist that verifies latency, cost, and eval score, but never checks whether the eval set is still representative or whether the training data leaked into it, is verifying the wrong layer. Add a data quality gate as a release-blocking step for the highest-severity findings — confirmed leakage, or an eval set past its staleness threshold — and a warn-only step for the rest.
Comparing detection approaches
Not every team has the same budget for data quality tooling. The comparison below separates approaches by what they actually catch and what they cost to run.
| Approach | Catches well | Misses | Relative cost |
|---|---|---|---|
| Manual spot-checking by an engineer | Obvious labeling mistakes, glaring imbalance | Leakage, slow drift, anything below the sample size an engineer has time for | Low tooling cost, high ongoing time cost |
| Fixed-threshold automated checks | Sudden, large shifts that cross a hardcoded line | Gradual drift, seasonal false positives/negatives, anything the threshold wasn't tuned for | Low-to-medium; needs threshold maintenance |
| Baseline-comparison automated checks (this article's model) | Gradual drift, segment-level regressions, stale eval sets, leakage via duplicate detection | Failure modes nobody defined a check for; still needs a human to interpret flagged findings | Medium; needs a maintained baseline |
| Continuous human-in-the-loop labeling review | Label noise and edge-case coverage most directly | Does not scale to every row; sampling strategy still matters | Highest ongoing cost, highest ground-truth confidence |
In practice, most mature pipelines combine the last two: automated baseline comparison for continuous, cheap coverage across all five failure modes, with a periodic human-in-the-loop labeled sample anchoring the automated signals to real ground truth. Relying on only fixed thresholds tends to produce either alert fatigue or blind spots, because a threshold tuned for one season of traffic rarely stays correct for the next.
Illustrative data quality check
The following pseudocode shows the shape of a Capture-Measure-Compare-Gate check running against a batch of new data. It is illustrative — adapt field names, storage, and thresholds to your own pipeline rather than treating this as a runnable library.
# Illustrative: not a runnable check against a specific schema.

baseline = load_baseline(dataset="support-tickets", window="last confirmed stable period")
new_batch = load_batch(dataset="support-tickets", window="this week")

label_agreement = sample_and_relabel(new_batch, n=150, annotators=2)
drift_score = distribution_shift(baseline.inputs, new_batch.inputs)
leak_hits = find_overlap(new_batch.eval_split, new_batch.train_split)
category_counts = count_by_category(new_batch)
eval_age_days = days_since(new_batch.eval_set_last_refreshed)

findings = []

if label_agreement < AGREEMENT_FLOOR:
    findings.append(flag("label_noise", severity="warn"))

if drift_score > DRIFT_THRESHOLD:
    findings.append(flag("drift", severity="warn"))

if leak_hits > 0:
    findings.append(flag("leakage", severity="block"))

for category, count in category_counts.items():
    if count < MIN_VIABLE_SAMPLE.get(category, 0):
        findings.append(flag("imbalance", severity="warn", detail=category))

if eval_age_days > STALENESS_THRESHOLD_DAYS:
    findings.append(flag("stale_eval", severity="block"))

gate_decision = resolve_gate(findings)
The pattern worth keeping even outside this exact shape: each failure mode produces its own finding with its own severity, rather than one blended score, so the gate decision can be traced back to a specific, explainable cause.
Separating real data quality issues from expected variation
Not every flagged finding is a genuine problem. A short sanity pass before escalating:
- Sample size. A 10-point drop in agreement on a 12-row sample is not evidence; the same drop on 200 rows is. Set a minimum sample size before trusting any measured signal.
- Known, reviewed changes. A drift finding that maps cleanly onto an intentional, reviewed product change (a new feature, an approved policy update) is a known cause to document, not an open investigation.
- Category-specific vs. system-wide. A finding isolated to one rare category usually needs a narrower fix than a finding that spans the whole dataset. Treat them with different urgency and different owners.
- Direction and persistence. A metric that dipped for one batch and recovered is more likely noise than a real regression; a metric that keeps moving in the same direction across several batches is the stronger signal.
Limitations and failure modes of this approach
Data quality checks reduce risk; they do not eliminate it. Distribution-based drift and staleness checks are proxies — they can flag a shift that turns out to be benign, such as a genuinely more diverse but still-correct batch of new traffic, and a human still has to interpret the finding. Label-agreement sampling only covers the sample it draws; a small, cheap sample can miss a rare but serious labeling error that a larger sample would have caught. Leakage checks built on exact or near-duplicate detection can miss subtler forms of leakage, such as a feature that encodes future information without being a literal duplicate row. And no automated gate replaces a periodic, deliberately fresh, human-reviewed eval sample — the checks in this article narrow down where a regression likely lives, they do not replace confirming what actually happened to real-world accuracy.
Treat every threshold and sample size in this article as a starting point, not a fixed constant — they need tuning against your own data volume, category rarity, and tolerance for false positives before they are trustworthy in your specific pipeline.
The release checklist and next action
- [ ] Every training and eval row records its input, label, source, and timestamp.
- [ ] Each of the five failure modes has at least one concrete, sampled measurement, not one composite score.
- [ ] Measurements are compared against a recorded, confirmed-stable baseline, not a threshold set once and never revisited.
- [ ] Gate severity is calibrated per failure mode — leakage blocks, minor category imbalance usually warns.
- [ ] The eval set's last-refreshed date is tracked and reviewed on a cadence, not left as a launch-day artifact.
- [ ] A periodic human-labeled sample anchors the automated proxy signals to real ground truth.
A flat accuracy number and a healthy data pipeline are two different claims, and only one of them is being checked by most teams' existing dashboards. Building the second check does not require replacing your model, your eval framework, or your annotation tooling — it requires capturing enough about each row to compare it against a real baseline, on a schedule, before the gap between what the eval set measures and what production actually does becomes someone else's support ticket.
Frequently asked questions
What is data quality in machine learning, specifically?
A set of measurable, row-level properties — correct labels, representative distribution, no leakage between training and evaluation splits, adequate coverage of rare but important cases, and an eval set that still reflects current production traffic — rather than one aggregate score.
Can a model's accuracy stay flat while data quality is degrading?
Yes. A stale eval set is the clearest example: it keeps producing a stable number because it keeps asking the same fixed questions, even after production traffic has moved on to different questions the eval set never covers.
How is data leakage different from data drift?
Leakage is information that should not be available leaking into training or into both the train and eval splits, which inflates the eval score artificially. Drift is a real shift in the underlying data distribution over time. Leakage makes a score look better than reality; drift makes reality diverge from what the data represents.
How often should an eval set be refreshed?
On a defined cadence tied to how quickly your product, user base, or language changes — tracked explicitly as the eval set's last-refreshed date, and reviewed whenever a segment-level regression is suspected, rather than left untouched indefinitely from launch.
Do these checks require a fully labeled production dataset?
No. Distribution comparisons, duplicate detection, and category counts work without full production labels. A small, periodic human-labeled sample strengthens the checks by anchoring proxy signals to real ground truth, but it is not required to start measuring drift, imbalance, or staleness.
Practical field notes from the team building Tracify and operating AI agents in production.
Related posts


Next in the loop
Enterprise AI adoption trends: A governance framework that actually ships
Keep reading →