What Is AI Observability? A Practical Definition for Production Teams
A grounded definition of AI observability, why traditional monitoring falls short for AI systems, and the evidence layers a team needs to explain what an AI system actually did.
In this guide11 sections
At a glance
AI observability is the practice of instrumenting an AI system so a person can explain, after the fact, what it saw, what it decided, and why the outcome was right or wrong — not just whether the request returned a status code. It extends traditional software observability (logs, metrics, traces) with the layers that are unique to AI systems: prompts and model versions, retrieved context, tool calls, non-deterministic output, and a judgment of whether the output was actually good.
| Question | Traditional monitoring answers it? | AI observability answers it? |
|---|---|---|
| Did the request return 200? | Yes | Yes |
| Was the answer factually correct? | No | Yes, with evaluation |
| Which prompt version produced this output? | No | Yes, with versioned traces |
| Did the model use stale or wrong context? | No | Yes, with retrieval spans |
| Is quality drifting release over release? | No | Yes, with evaluation trend data |
This article is for engineers, platform owners, and technical leaders who keep hearing "AI observability" in vendor pitches and want a definition they can actually use to scope a project — not a marketing description. It defines the term precisely, explains why uptime dashboards are not enough, and lays out the four evidence layers a real implementation needs. It does not compare specific vendors or tools; AI observability tools and AI observability platform cover buying decisions.
Start with what observability means in software
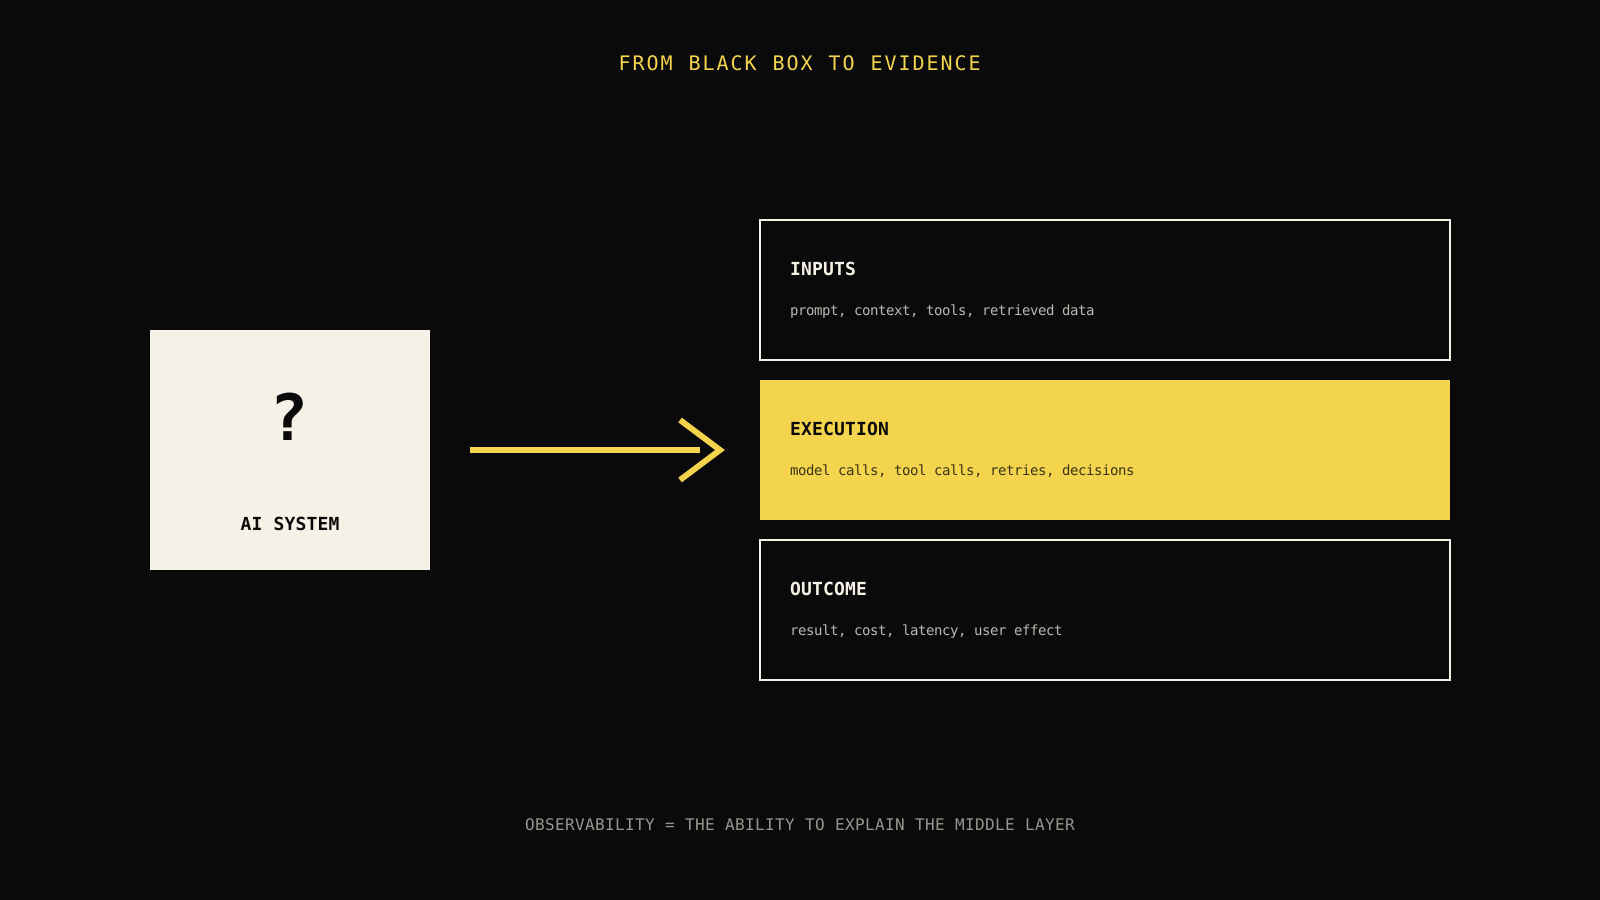
"Observability" is a borrowed term from control theory: a system is observable if its internal state can be inferred from its external outputs. In software engineering it usually means three things working together — logs (discrete events), metrics (aggregated numbers over time), and traces (the causal path of one request through a distributed system). Datadog, Honeycomb, and OpenTelemetry built an entire industry on this three-pillar model, and it works well for deterministic systems: a web request either hits the right code path or it doesn't, and the same input reliably produces the same output.
AI observability keeps that foundation but adds a fourth pillar: judgment — an explicit, repeatable assessment of whether the output was actually correct, safe, and useful. Traditional observability can tell you a service is up. It cannot tell you a language model hallucinated a policy that does not exist, or that an agent called the wrong tool with the right arguments. That gap is the entire reason "AI observability" exists as a distinct discipline rather than a rebrand of APM.
Why the gap exists
Three properties of AI systems break the assumptions traditional monitoring is built on:
- Non-determinism. The same prompt against the same model can produce different outputs on different calls. A green dashboard measuring "did the call succeed" says nothing about whether this particular output was acceptable.
- Semantic failure. Most AI failures are not exceptions or non-200 responses. The system runs to completion, returns a fluent, well-formatted answer, and that answer is wrong. There is no stack trace for "the model was confidently incorrect."
- Context dependency. A model's behavior depends on the prompt template, the retrieved documents, the tool results, and the conversation history at that moment — none of which show up in a typical request log unless you deliberately capture them.
Field note: A team that ships an LLM feature with only HTTP-level monitoring will have a dashboard that stays green through an entire quality regression. The first signal is usually a support ticket, not an alert.
Define AI observability precisely
Use this working definition: AI observability is the combination of instrumentation, evaluation, and alerting that lets a person reconstruct and judge what an AI system did for a specific interaction, and detect when that behavior degrades across many interactions.
Three clauses do the work in that sentence:
- "Reconstruct" requires a trace: the prompt, model, parameters, retrieved context, tool calls, retries, and final output, connected by a stable identifier.
- "Judge" requires evaluation: an automated or human assessment of whether the output met the task's actual bar, not just whether it parsed.
- "Detect degradation across many interactions" requires aggregation and alerting: dashboards and thresholds that turn individual traces into a signal a team can act on before users notice.
Drop any one of the three and you have something else, not a smaller version of AI observability. Logs alone are debugging, not observability — you can look at one bad response, but you cannot see the trend. Dashboards without traces are monitoring — you can see that quality scores dropped, but not why. Evaluation without alerting is a research exercise that never reaches production operators.
The four evidence layers
A working AI observability implementation produces four connected layers of evidence. Each layer answers a different question, and skipping one leaves a blind spot that the others cannot cover.
| Layer | Answers | Typical artifact |
|---|---|---|
| Traces | What did the system actually do, step by step? | A structured record of prompt, model, retrieval, tool calls, and output |
| Evaluations | Was the output actually good? | A score from an automated grader, a rule check, or a human rater |
| Cost and latency | What did this cost, and how long did it take? | Token counts, provider cost, per-step and end-to-end latency |
| Alerts | Who needs to act, and how urgently? | A threshold breach routed to an owner with the evidence attached |

A useful trace is a causal record, not a transcript — it should let a person reconstruct the path from input to output, not just archive the final text.
Traces: the causal record
A trace for an AI system needs more fields than a typical HTTP trace. At minimum, capture the prompt template and version, the exact rendered prompt (or a redacted reference to it), the model and its parameters, every tool call with arguments and results, retrieved documents with their source and freshness, retries and their reasons, and the final output. LLM tracing explained covers the mechanics of propagating these fields through a distributed agent call, including span naming and context propagation with OpenTelemetry.
{
  "run_id": "run_88f2",
  "prompt_version": "refund-policy-v4",
  "model": "gpt-4.1",
  "retrieval": [{ "source": "kb/refund-policy.md", "freshness_hours": 2 }],
  "tool_calls": [{ "name": "get_order", "args": { "order_id": "A-9931" }, "status": "ok" }],
  "output": "Refund approved for $42.00",
  "eval": { "grounded": true, "policy_match": false }
}
The last field is the one traditional logging never captures on its own: policy_match: false. The trace shows the model produced a fluent, tool-grounded answer that still contradicted policy — a failure mode a status-code dashboard cannot see and a raw log file would only reveal to someone who happened to read that exact entry.
Evaluations: judgment, not just capture
Evaluation is what separates observability from a data warehouse. Without it, a team accumulates traces indefinitely and still cannot answer "is this getting better or worse?" A minimal evaluation layer needs:
- Task-specific correctness checks — did the output match the ground truth, satisfy a rule, or pass a policy check?
- Groundedness checks — is every factual claim traceable to retrieved or tool-provided evidence?
- Safety and policy checks — did the system stay inside its authorized boundary?
- A comparison baseline — a fixed regression set that every prompt, model, or retrieval change is measured against before and after.
AI evaluation metrics walks through choosing metrics for a specific workflow instead of adopting a generic quality score that hides which dimension actually regressed.
Decision rule: If a metric cannot tell you which prompt, model, or data change caused it to move, it belongs in a research notebook, not a production dashboard.
Cost and latency: the operational constraints
AI systems introduce cost and latency variables that traditional software rarely has: token usage that scales with input and output length, provider pricing that changes model to model, and latency that compounds across chained model and tool calls. Observability needs to connect these numbers to the same trace identifier as quality, because a cheaper model that saves money while quietly failing more often is not actually an improvement. Reduce LLM costs without hurting quality covers this trade-off directly.
Alerts: turning evidence into action
The final layer routes evidence to a person who can act. A regression detected at 2am with no owner and no next step is not an alert — it is a log line with a louder color. A working alert names the affected workflow, the metric that moved, the representative trace, the release or version most likely responsible, and the first safe action (rollback, pause, escalate). AI agent monitoring covers how to design alerts that lead somewhere instead of accumulating as noise.
Why "AI observability" outgrew "LLM monitoring"
Early tooling in this space called itself "LLM monitoring" or "prompt logging," and for single-call chatbot use cases that scope was close to sufficient. The term shifted to "AI observability" as systems grew more complex: retrieval-augmented pipelines with multiple retrieval steps, agents that call tools and other agents, and multi-turn workflows where a failure in step three only shows up in the user-visible output at step seven.
This is also why "generative AI observability" and "AI observability" are frequently used interchangeably in the wild: nearly all production AI systems today are built on generative models, so the distinction rarely changes what you instrument. The meaningful distinction is single-call versus multi-step, not generative versus non-generative — a single-turn classifier and a five-step agent need very different trace depth even if both are technically "generative AI."
What AI observability is not
Precision here saves teams from expensive detours:
- It is not a replacement for application performance monitoring. You still need infrastructure metrics, error rates, and uptime monitoring for the services around the model. AI observability is additive, not a substitute.
- It is not the same as a prompt playground. A tool for testing prompts interactively is useful for development but does not capture production traffic, versioned releases, or trend data.
- It is not just a chat transcript viewer. Storing the conversation is necessary but not sufficient; without structured evaluation and cost/latency data attached, a transcript store is a searchable archive, not an observability system.
- It is not a single metric. No single "quality score" captures correctness, groundedness, safety, cost, and latency simultaneously without hiding which dimension actually failed.
| Looks like observability | Is missing |
|---|---|
| A dashboard of API latency and error rates | Any judgment of output correctness |
| A searchable log of prompts and completions | Structured evaluation, versioning, and trend comparison |
| A single "AI quality score" | Attribution to a specific cause (prompt, model, retrieval, data) |
| Manual spot-checks by an engineer | Coverage across the full production volume and a repeatable baseline |
Build the minimum viable implementation
You do not need every field from day one. A useful starting point, in order:
- Instrument one workflow completely before spreading thin instrumentation across many. Capture the full trace for a single high-value user journey: prompt, model, retrieval, tool calls, and output.
- Attach a small evaluation set. Ten to twenty representative cases with known-good answers are enough to catch an obvious regression before a larger evaluation program exists.
- Add one alert with a real owner. Pick the single metric that would embarrass the team most if it silently regressed, and route it to a person, not a channel nobody reads.
- Only then expand to more workflows, automated grading at scale, and cost dashboards.

Where teams get stuck
Most teams do not fail at step one — capturing a trace is mechanical once you commit to a schema. They stall at step two, evaluation, because it requires deciding what "good" means for a specific task, which is a product decision disguised as an engineering one. Debug AI agents in production walks through a concrete investigation using this evidence once it exists, which is a useful forcing function for figuring out what fields you actually need.
Step three, alerting, has a quieter failure mode: teams wire up a threshold and call it done, without asking who actually receives the notification and what they are expected to do with it. An alert that fires into a channel with no assigned owner is functionally the same as no alert — it satisfies a checklist item without changing behavior during an incident. Before adding a second or third alert, confirm the first one has actually changed how someone responds to a regression; if it has not, the instrumentation is complete but the operating practice around it is not.
Decision rule: If you cannot describe, in one sentence, what a correct output looks like for a given input, you are not ready to build an automated evaluator for it yet — you need a human-rated pilot first.
Read the lower half visually

Coverage is a spectrum, not a switch you flip once. Raw logs answer "did it crash?" and nothing more. Tracing alone answers "what steps ran?" but still cannot say whether the output was good. Only the full four-layer implementation — traces, evaluation, cost and latency, and owned alerts — closes the loop from evidence to action, which is why teams that stop at tracing often believe they have "AI observability" when they have captured only half the picture.
What changes the recommendation
A single internal prototype with one engineer maintaining it can live comfortably with lightweight logging and manual review; the cost of a missed regression is a Slack message, not a customer escalation. A customer-facing agent handling regulated data, multiple releases per week, and a support team fielding complaints needs the full four-layer implementation with named owners per signal. The size of the gap between those two situations is usually underestimated until the first serious incident forces the question, at which point retrofitting instrumentation onto months of unrecorded history is far more expensive than building it in from the start.
Leave the reader with the next move
- [ ] You can state, in one sentence, what "correct" means for your highest-value AI workflow.
- [ ] One workflow has a complete trace: prompt, model, retrieval, tool calls, and output, connected by a stable run identifier.
- [ ] A small evaluation set (ten to twenty cases) exists and is versioned, not just a folder of ad hoc examples.
- [ ] At least one alert is routed to a named owner with a representative trace attached, not a shared channel nobody reads.
- [ ] You know which of the four evidence layers — traces, evaluation, cost/latency, alerts — is currently missing, and which one you will add next.
Pick the workflow with the highest cost of silent failure and run it through this checklist this week. A single fully instrumented workflow with a working evaluation loop teaches your team more than a partial rollout spread thin across every feature you ship.
Common failure patterns without observability
Teams that skip AI observability tend to discover the same handful of failure patterns, usually the hard way:
- Silent quality regression after a model or prompt change. A vendor updates a model version behind an API alias, or a prompt edit intended to fix one case breaks another, and nobody notices until user complaints accumulate.
- Unexplained cost spikes. A retry loop or a verbose prompt template quietly multiplies token usage, and the first sign is a finance question, not an engineering alert.
- Irreproducible bug reports. A user reports a bad answer, and without a trace tied to that exact interaction, engineering cannot tell whether it was a one-off model sampling issue or a systemic problem.
- Compounding errors in multi-step agents. A wrong tool call three steps into a chain produces a plausible-looking final answer, and without step-level evaluation, the team only sees the polished (wrong) output.
Frequently asked questions
Is AI observability different from LLM observability?
They largely overlap. LLM observability is often used for single-model-call systems, while AI observability (and agentic AI observability) covers broader systems including multi-step agents, tool calls, and retrieval pipelines. The underlying evidence model — traces, evaluation, cost/latency, and alerts — is the same.
Do I need a dedicated platform, or can I build this myself?
You can start with open-source tracing (OpenTelemetry) plus a spreadsheet-based evaluation set for a single workflow. As the number of workflows, releases, and required integrations grows, the maintenance cost of a self-assembled stack usually exceeds the cost of an integrated platform; see the tools and platform guides for that trade-off in detail.
What is the very first thing to instrument?
Pick the single workflow with the highest cost of being wrong — usually the one closest to a customer or a financial action — and capture its complete trace end to end before spreading thin instrumentation across every feature.
How is this different from just logging prompts and completions?
Logging captures raw material. Observability adds a consistent schema, version tracking, evaluation of whether outputs were actually good, and alerting that routes regressions to an owner. Without those three additions, a prompt log is an archive nobody queries until it is too late.
Does AI observability apply to non-LLM AI systems, like classical ML models?
The core idea — being able to explain a system's behavior after the fact and detect drift — applies to any ML system. Classical ML observability tends to focus more on feature and prediction drift; generative AI observability adds prompt, retrieval, and tool-call evidence because the failure surface is different.
Practical field notes from the team building Tracify and operating AI agents in production.
Related posts
Next in the loop
AgentOps vs Tracify: Auto-Instrumentation vs Integrated Evaluation
Keep reading →