Monitoring vs observability: What actually explains an AI agent failure
Monitoring tells you a system is unhealthy. Observability tells you why. A decision framework for choosing the right instrumentation for deterministic services and non-deterministic AI agents.
In this guide11 sections
At a glance
If you run anything in production — a web service, a batch pipeline, or an AI agent — you have almost certainly used the words "monitoring" and "observability" interchangeably. Vendors do it too: dashboards get called observability platforms, and alerting tools get called monitoring solutions, sometimes for the exact same product. That looseness is harmless until the night your dashboards are green and your users are still furious.
This article draws the line precisely, then applies it to the case where the distinction matters most: AI agents and other non-deterministic systems, where the failure surface is not just "is the server up" but "did the model, given this exact context, make a reasonable decision." You'll get a working definition of both terms, the three classic observability pillars plus three more that agentic systems require, a decision framework for choosing instrumentation, and the specific misconceptions that cause teams to under-invest in the wrong one.
Who this is for: engineers and technical leads operating LLM-backed services, agents, or pipelines who need to decide what to instrument, what to alert on, and what to leave as ad-hoc query capability. What this does not cover: vendor selection or pricing comparisons — see the individual product comparison guides linked at the end for that — and it does not cover infrastructure-only monitoring (CPU, memory, network) except where it intersects with agent behavior.
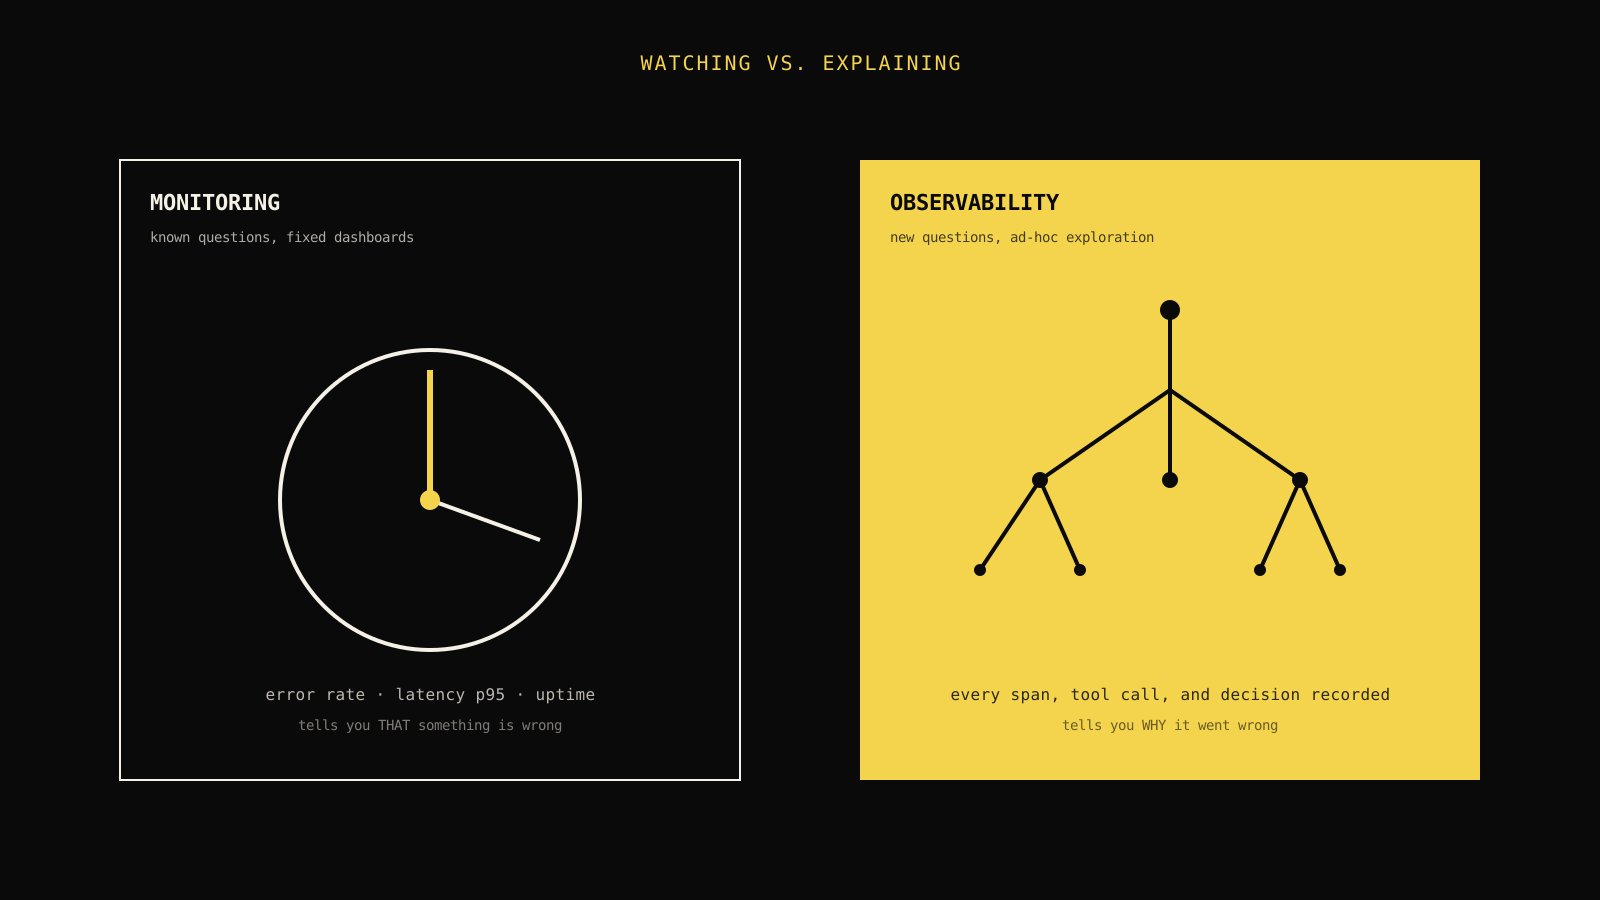
Monitoring answers questions you already knew to ask. Observability answers questions you didn't know you'd need to ask until the incident was already happening.
The operating model
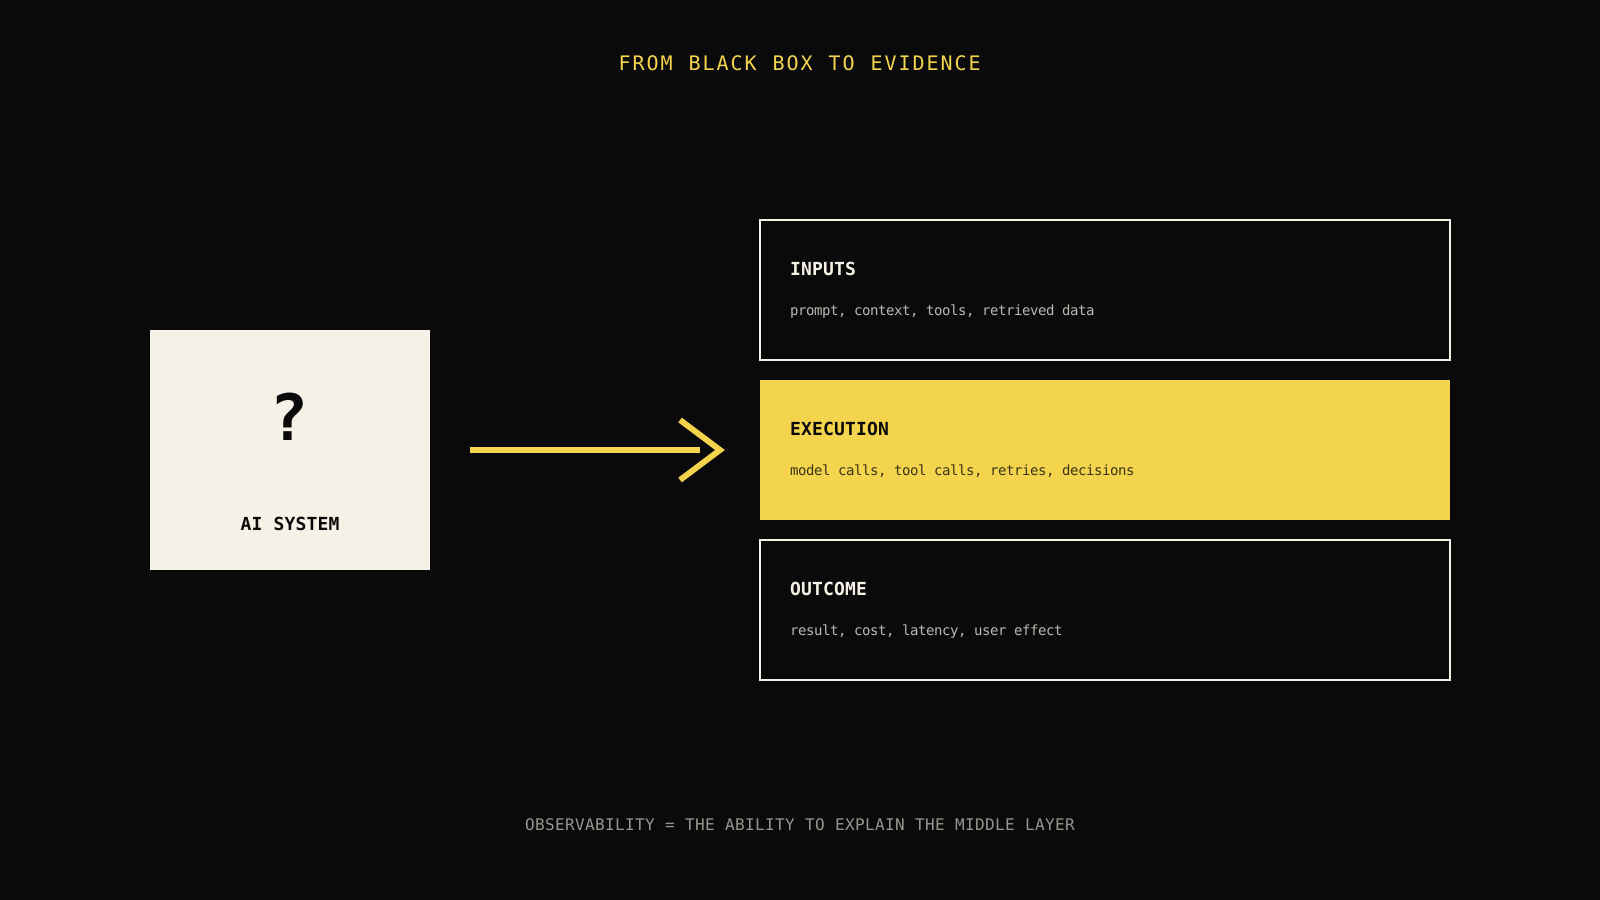
The framework this article uses is simple and it will recur in every section: known-unknowns versus unknown-unknowns. Monitoring is built for known-unknowns — conditions you can name in advance, attach a threshold to, and alert on. Observability is built for unknown-unknowns — the failure you cannot name until you're inside the incident, and the only way out is to ask new questions of data you already recorded.
| Property | Monitoring | Observability |
|---|---|---|
| Question shape | "Is X within range?" | "Why did X happen?" |
| Built from | Pre-defined dashboards, alerts, thresholds | Raw, high-cardinality event and trace data you can query freely |
| Best at | Detecting that something is wrong, fast | Explaining an unfamiliar failure after the fact |
| Fails when | The failure mode wasn't anticipated | The underlying data wasn't captured at all |
| Agent-specific extension | Uptime, latency, token throughput | Per-run traces, eval scores, tool-call outcomes |
Neither replaces the other. Monitoring is the smoke detector — cheap, always on, tuned to a small number of known risks. Observability is the ability to reconstruct exactly what happened inside the building after the alarm goes off. You want both, and for agentic systems you need observability earlier in the build process than most teams expect, because the "known" failure modes are a much smaller fraction of the total failure surface than they are for a typical CRUD service.
Start with the user outcome
The reader outcome this article aims for is concrete: after reading, you should be able to look at your current stack and say which of your instrumentation is monitoring, which is observability, and where the gap is that will bite you during the next incident you didn't anticipate.
Separate symptoms from the decision
Take the incident from the opening scenario. The monitoring layer did its job completely: error rate crossed a threshold, PagerDuty fired, an engineer was paged within ninety seconds. That is monitoring working exactly as designed — it answered "is something wrong?" correctly and quickly.
What monitoring could not do is answer the next question, "what is wrong?" The dashboards on hand were built around anticipated failure categories: HTTP error codes, queue depth, model API latency. None of those were red. The actual defect — a downstream tool silently truncating its response payload, causing the model to fabricate the missing half of a customer's order history — was not a metric anyone had thought to chart, because nobody anticipated that specific failure before it happened.
The engineer's path from "confirmed something is wrong" to "found the cause" required pulling the full trace for several failing runs: the exact prompt sent, the exact tool call and its exact raw response, the model's exact output, and the point at which the two diverged. That is observability — not a new dashboard, but the ability to ask a question nobody wrote a dashboard for.
Field note: The single fastest way to tell whether you have observability or just monitoring is to ask: "If a completely new failure mode showed up tomorrow, could I investigate it with data I already have, or would I need to ship a code change and wait for it to recur?" If the honest answer is the latter, you have monitoring and a blind spot.
Build the evidence chain
Monitoring and observability are not two products — they're two capabilities usually built from overlapping raw material, but assembled differently. The industry standard breakdown for classic software observability is "three pillars": logs, metrics, and traces. For AI agents, that breakdown is necessary but insufficient — it was designed for a world where the same input reliably produces the same output, and where "correctness" is a deterministic property you can assert with a unit test. Non-deterministic, tool-using agents need three more.

The three classic pillars
Logs are discrete, timestamped events — "request received," "database connection failed," "retry attempted." They're cheap to write and easy to grep, but expensive to query at scale and easy to under-instrument; a log line only exists if someone thought to write it.
Metrics are numeric time series — request count, error rate, memory usage, p50/p95/p99 latency. They compress well, which makes them ideal for dashboards and alerting, but that same compression destroys the per-request detail you need to explain a specific failure.
Traces connect a single request's path through every service, function, and dependency it touched, with timing for each step. A trace is the closest thing to a replay of exactly what happened for one specific execution — which is exactly what you need when a metric tells you something is wrong but not what.
The three pillars agentic systems add
Evals replace the unit test. A deterministic function either returns the right value or it doesn't; an LLM call might be "correct" in one phrasing and subtly wrong in another that looks similar on the surface. Evals — rubric-based, model-graded, or human-reviewed scoring applied to live or sampled traffic — are how you turn "this output seems fine" into a number you can trend, threshold, and alert on. Without evals, you're monitoring uptime for a system whose actual job (giving correct, useful answers) you're not measuring at all.
Cost is not a nice-to-have metric for agents the way it might be for a typical API — it's a primary signal, because a single run can call the model multiple times, invoke tools, and retry on failure, and any of those can silently balloon. A cost spike is very often the earliest observable symptom of a retry loop, a prompt regression that makes the model "think" longer, or a tool call that starts returning much larger payloads than expected — well before that regression shows up as an error rate or latency metric.
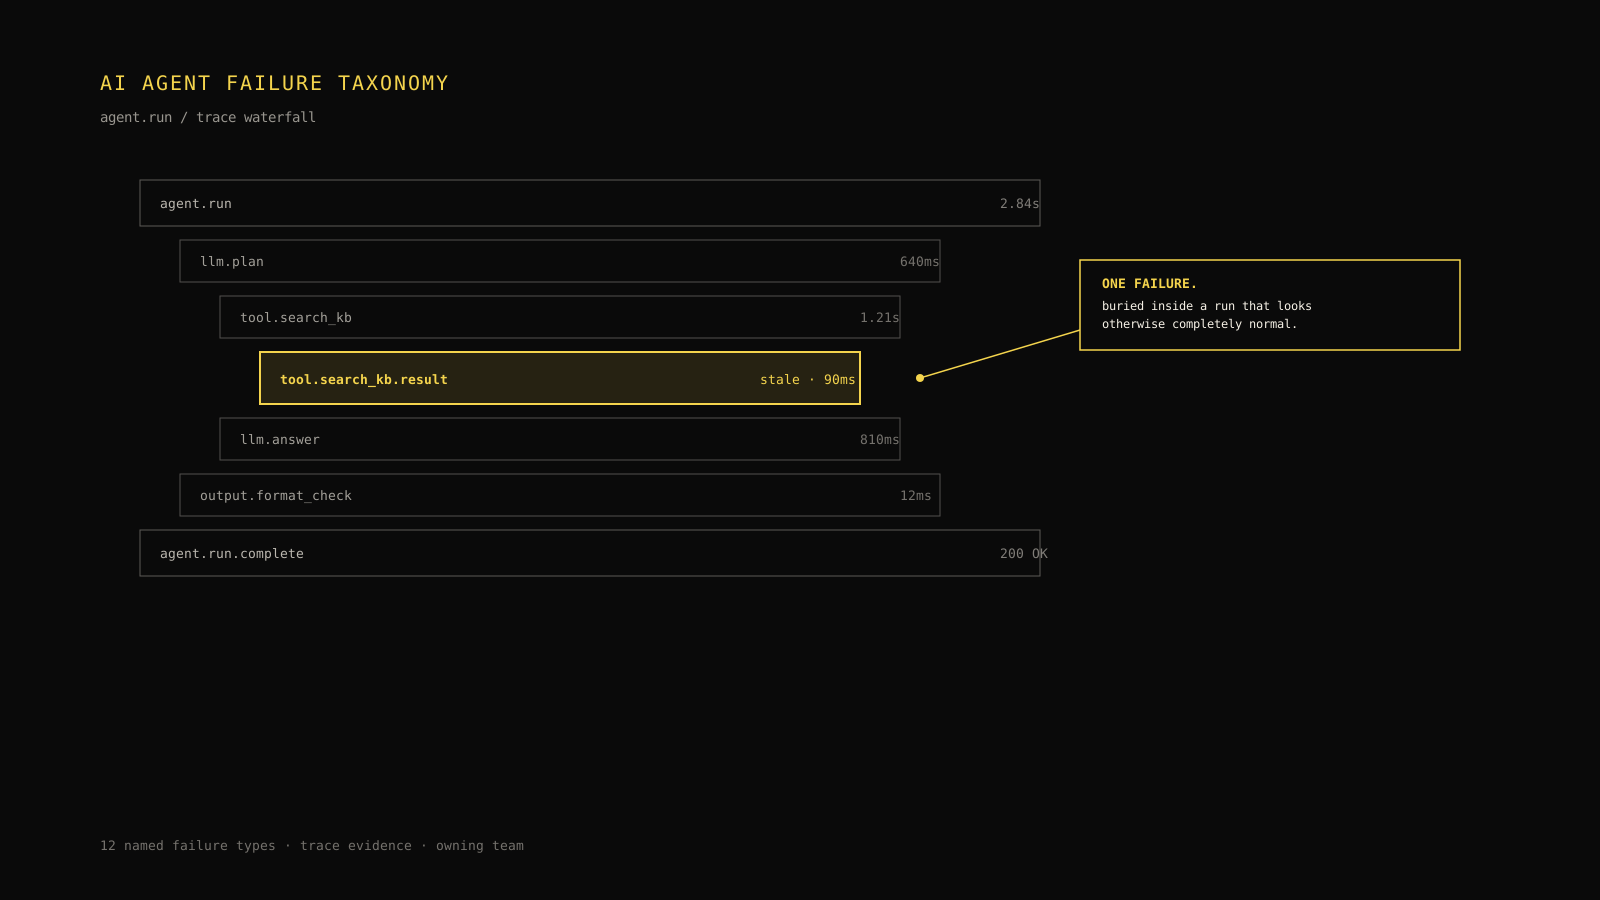
Tool calls are where agent-specific failure actually concentrates. An LLM call is (relatively) well understood: send a prompt, get a completion, maybe hit a rate limit. A tool call is a full external system boundary — an API, a database, a browser action, a function execution with real side effects — with its own failure modes, its own latency profile, and its own possibility of returning "successful but wrong" data (truncated pages, empty search results, a stale record) that a generic HTTP-status check will never catch.
Work through a realistic example
Consider a research agent that answers questions by searching the web, reading a handful of pages, and synthesizing an answer. Three weeks after launch, cost per completed run doubles without any deploy, and the team has to decide what actually happened.
| Observation | Weak interpretation | Better next move |
|---|---|---|
| Cost per run doubled, error rate unchanged | "The model provider raised prices" — check the billing page and move on | Pull traces for the highest-cost runs and compare token counts against the same query type from before the spike |
| Token count per run roughly doubled, same query types | "Users are asking longer questions now" | Diff the actual prompts sent — is the system prompt or retrieved context growing, not the user's question? |
| Retrieved context length doubled for one search tool | Assume the target sites changed and ignore it | Check the tool's response payloads directly — did a page-cleaning step in the tool stop stripping boilerplate, so the model is now reading twice as much raw HTML per source? |
Only the trace-level view — actual tool responses, actual prompt content, actual token counts per step — resolves this. The metric ("cost per run") told the team something changed. It could not, by itself, tell them what changed, because a single aggregate number is consistent with several very different underlying causes.
Diagnose the first divergence
The practical skill this article is building toward is finding the first point where a run's actual behavior diverges from its expected behavior, as early in the causal chain as possible. Every layer of instrumentation narrows the search differently:
- A metric tells you a divergence exists somewhere in a time window, across a population of runs.
- A trace tells you exactly where a specific run diverged from what you'd expect, step by step.
- An eval score tells you whether the output diverged from what "good" looks like, even when every individual step technically succeeded.
Use the eval score as the smoke detector for quality, and the trace as the flashlight — they solve different problems and neither substitutes for the other.
Compare the meaningful trade-offs
Monitoring and observability trade off differently along five axes that matter operationally: detection speed, explanatory depth, cost, storage, and team effort.
Detection speed favors monitoring; explanatory depth favors observability. Detection speed. Monitoring wins decisively. A threshold breach on a pre-aggregated metric can page someone in seconds. Observability data (full traces, high-cardinality attributes) is usually too expensive to alert on directly at high frequency; it's queried after a monitoring signal — or a user report — has already told you to look.
Explanatory depth. Observability wins decisively, by definition. A metric has already thrown away the per-request detail. No amount of staring at an aggregate error-rate graph will tell you which specific tool call is the cause; you need the underlying trace.
Cost and storage. This is real and worth being honest about. Full-fidelity traces for every run, retained indefinitely, get expensive fast — in ingestion cost, storage cost, and query cost. Most teams sample: retain 100% of failed or flagged runs, and a statistically useful sample of successful ones, rather than every trace forever.
Team effort. Monitoring is largely "set thresholds once, tune occasionally." Observability requires deliberate instrumentation up front (structured spans, consistent attribute naming, propagated context across tool boundaries) and an investigative habit during incidents — it's a capability the team has to practice, not a dashboard that runs itself.
Decision rule: If your alert fires on a metric that has no linked trace or run ID attached to it, you have detection without diagnosis. Fix that before adding another dashboard — the next incident will cost you the same investigation time regardless of how many more charts you build.
Protect the security boundary
Observability data is, almost by definition, sensitive. A full trace of an agent run can contain the user's actual prompt, retrieved documents, tool call arguments, and model output — which means it can contain PII, credentials pasted into a chat by mistake, or proprietary business data pulled from an internal tool. Treat trace storage with the same access controls you'd apply to application logs containing customer data, not as a separate, lower-stakes analytics dataset.
Concretely: scope who can query raw traces (not everyone who can see an aggregate dashboard should be able to read raw prompt content), redact or hash known-sensitive fields at ingestion where possible, set a retention window that matches your compliance obligations rather than "forever by default," and make sure API keys or secrets that occasionally leak into tool call arguments are never persisted in plaintext. None of the interaction or illustrative code in this article touches production data, secrets, or a live system — the worked examples are deliberately self-contained.
Read the lower half visually

The path above is the shape of nearly every incident on a system with real observability. The first two or three steps are monitoring: an alert fires, a known dashboard gets checked against it. The moment that dashboard runs out of relevant charts — and on an agent system, it usually does — the investigation shifts from "which known view explains this" to "what new question do I need to ask". That shift is only possible if the underlying data was captured with enough detail and enough query flexibility to support a question nobody anticipated when the dashboard was built.
A small illustrative example
The block below is intentionally minimal — it does not call a real API or execute in production — but it demonstrates the structural difference concretely: a monitoring check can only evaluate what it was written to check, while an observability query can be reshaped after the fact.
// Illustrative only — not a production monitoring or query client.

type RunSummary = { runId: string; errorRate: number; p95LatencyMs: number };
type Span = { runId: string; name: string; attrs: Record<string, unknown>; ms: number };

// Monitoring: a fixed, pre-defined check. It can only ever answer
// the question it was written to answer.
function monitoringCheck(summary: RunSummary): "ok" | "alert" {
  return summary.errorRate > 0.02 || summary.p95LatencyMs > 4000 ? "alert" : "ok";
}

// Observability: an ad-hoc query over raw spans, written *after*
// the incident, to answer a question nobody anticipated in advance.
function findOversizedToolResponses(spans: Span[], byteThreshold: number) {
  return spans.filter(
    (s) => s.name === "tool_call" && Number(s.attrs.responseBytes ?? 0) > byteThreshold,
  );
}
monitoringCheck can only ever alert on error rate and latency — the two conditions someone wrote in advance. findOversizedToolResponses did not exist until the incident described earlier made it obvious that "did a tool response silently grow" was the actual question. That function could only be written after the fact because the raw span data — every tool call, with its response size recorded as an attribute — was already being captured, whether or not anyone expected to need it.
Explain what changes the recommendation
Full-fidelity, unsampled tracing is not always the right first investment. A low-traffic internal tool, a single-tenant proof of concept, or a system with a genuinely narrow and well-understood failure surface may reasonably run on monitoring alone for a while. The recommendation shifts hard toward heavier observability investment as soon as any of these become true: the system is non-deterministic (LLM-backed), it's user-facing at meaningful scale, it involves tool calls with real side effects, or it has already produced one incident that took more than an hour to diagnose because nobody could ask the question the incident required.
Make the operating decision
Carrying the research-agent cost example to its conclusion: the team's fix was not a new dashboard. It was adding a responseBytes attribute to every tool-call span (closing the exact gap the illustrative query above assumes exists), plus an eval that scores whether retrieved context is relevant versus boilerplate. The monitoring layer — cost-per-run and error-rate alerts — is what told them to look. Understanding what AI observability actually requires as a discipline, not a single dashboard, is what let them ask the right question once they knew where to look. And because the root cause showed up first as a trace-level anomaly rather than a labeled error, it's worth reading how LLM tracing works end to end before deciding your span schema — retrofitting attributes after the fact is exactly the expensive path this section is trying to help you avoid.
Leave the reader with the next move
- [ ] Every alert you have is linked to a trace or run ID, not just a bare number.
- [ ] You can name, concretely, one failure mode from the last quarter that monitoring did not anticipate.
- [ ] Tool calls emit spans with enough attribute detail (response size, latency, status) to diagnose a silent behavior change, not just a hard failure.
- [ ] At least one eval exists that scores output quality, not just system uptime.
- [ ] Trace retention and access controls match your data-sensitivity policy, not a default "keep everything forever" setting.
- [ ] The rendered article has been checked from the opening through the FAQ on desktop and mobile.
If most of those boxes are unchecked, the fastest correction is not a new dashboard — it's adding structured spans (with run IDs, tool I/O, and token counts) to your existing pipeline this week, before the next incident forces you to reconstruct behavior you never recorded.
Frequently asked questions
Is observability just 'better monitoring' with more dashboards?
No. More dashboards still only answer questions someone thought to build a chart for. Observability is the underlying data and query capability that lets you answer a question nobody anticipated, after the fact, without shipping new instrumentation first.
Do I need observability if my monitoring already covers uptime, latency, and error rate?
Those three cover 'is it broken,' which is necessary but not sufficient for an LLM-backed system, where a run can return a 200 with normal latency and still produce a wrong, unsafe, or unhelpful answer. That failure mode is invisible to uptime and latency monitoring and only shows up in traces and evals.
Why do AI agents need more pillars than logs, metrics, and traces?
Because 'correct' isn't a deterministic property for an LLM call the way it is for a typical function, and because a single run can span multiple model calls and tool calls, each with its own cost and failure surface. Evals measure output quality, cost tracks a genuinely variable per-run expense, and tool-call instrumentation covers the external system boundaries where most agent-specific failures actually occur.
How much trace data should I actually store?
Retain full-fidelity traces for every failed or flagged run, and a statistically useful sample of successful runs — full retention of every run forever is rarely worth the storage and query cost. Match retention windows to your compliance requirements, and treat trace content with the same access controls as any dataset that can contain user PII or business data.
What's the single highest-leverage first step if I only have monitoring today?
Add a stable run ID that propagates through every model call and tool call, and start capturing structured spans with real attributes (token counts, tool response sizes, latency per step) for at least your failed runs. That one change turns your existing logs into something you can actually query when the next unanticipated failure happens.
Practical field notes from the team building Tracify and operating AI agents in production.
Related posts
Next in the loop
AI Agent Audit Trails: Building Compliance-Ready Evidence for SOC 2 and GDPR
Keep reading →