AI Agent Observability vs Traditional APM: What Changes and What Stays the Same?
A category-level comparison of what traditional APM covers, what AI-specific observability adds for agents, and why most production AI systems need both layers working together.
In this guide14 sections
At a glance
Traditional APM was built to answer one question well: is the request path healthy? It watches latency, error rates, uptime, and resource usage, and it does that job thoroughly. It was never built to answer a second, different question: was the answer the agent gave actually right? That second question — output correctness, tool-selection quality, retrieval relevance, and prompt/response content — is what AI-specific observability adds. Neither layer replaces the other. A production AI agent's request path can be perfectly healthy by every APM metric while it is quietly giving a specific category of users wrong answers, because correctness was never a signal APM was instrumented to see. Most production AI systems need both layers: APM for the request path, AI observability for whether the agent's decisions and answers were actually right. This article works through where each layer's coverage starts and stops, using a single incident, a signal-by-signal comparison, and a scenario-based check you can apply to your own stack.
This is a category-level comparison — what AI observability is and how to choose among AI observability tools cover those topics in depth and are not repeated here.
The operating model: the Layered Coverage Model
The framework this article uses is the Layered Coverage Model: every signal an AI agent produces sits in one of two layers — an infrastructure layer (request path health) and a decision layer (whether the agent's reasoning and output were correct) — and the two layers are covered by different tooling with a small, well-defined overlap. The model's use is mechanical: for any given signal, ask "does APM see this?" and "does AI observability see this?" independently, then read the row. Most rows have exactly one "yes." That asymmetry, not a vague sense that AI agents are "different," is the actual argument for running both layers.
| Layer question | What it tells you | Who answers it |
|---|---|---|
| Is the request path healthy? | Latency, errors, uptime, resource usage | Traditional APM |
| Was the decision or output correct? | Prompt/output content, tool choice, retrieval relevance, correctness | AI-specific observability |
| Both together | Whether a real production incident is even visible at all | The combined trace |
What traditional APM was built to observe
Application performance monitoring earned its place in production stacks by solving a genuinely hard problem: distributed systems fail in ways that are invisible from any single service's local view, and someone has to see the whole request path. That problem predates LLM-based agents by two decades and it has not gone away — an AI agent is still a service that receives a request, calls other services, and returns a response, and every one of those hops can degrade in the ordinary ways any hop can degrade.
APM does this well:
- Latency, end to end and per hop. p50/p95/p99 timing across every service and dependency in the call chain, so a regression can be localized to the exact hop that slowed down.
- Error rates and status codes. 4xx/5xx counts, exception rates, and their trend over time, broken down by endpoint, service, and deploy version.
- Uptime and availability. Whether the service is reachable at all, and for how long it was not, against an SLA or SLO.
- Resource usage. CPU, memory, connection pool saturation, queue depth — the physical and infrastructural constraints that predict an outage before it happens.
- Dependency health. Database query time, downstream API latency, cache hit rate, and the cascading effect one slow dependency has on everything calling it.
- Deploy correlation. Tying a metric regression to the specific release that caused it, which is often the fastest path to a rollback decision.
This is not a small list, and it is not easy to build well. Distributed tracing, service maps, anomaly detection on metric baselines, and alerting that avoids both false positives and alert fatigue are mature, well-solved problems that a serious APM product handles better than most teams could build in-house. An AI agent that calls a model API, a vector database, and three internal tools is, from APM's point of view, a service with several dependencies — and APM will correctly tell you if any of those dependencies gets slow, starts erroring, or falls over. If your agent's model provider starts timing out, APM sees it. If a tool call's downstream API returns a wave of 500s, APM sees it. If a deploy introduces a memory leak that eventually OOMs the process, APM sees it, usually before your users notice.
None of what follows in this article is an argument that this coverage is unnecessary or that APM should be replaced. An AI agent still runs on infrastructure, and infrastructure still fails in infrastructure ways. The argument is narrower and more precise: APM's instrumentation was designed around request/response shape, timing, and status codes — signals that exist for any service — and an AI agent produces a second category of signal that has no equivalent in a typical request/response service, because the "response" is not just data returned, it is a decision.
What's different about an AI agent's failure surface
A traditional service fails in ways that show up as a status code, a timeout, or a stack trace. An AI agent can fail while returning 200 OK, in well under its p95 latency budget, with a syntactically valid, well-formatted, confidently worded response — and be wrong.
This isn't a philosophical distinction. It changes what "failure" means as an event your monitoring can detect:
- A tool-call failure surfaces as an exception. A tool-selection failure — the agent picking the wrong tool, or the right tool with the wrong arguments — surfaces as nothing at the infrastructure layer. The call succeeds; it's just the wrong call.
- A timeout surfaces as latency. A stale retrieval — the agent confidently answering from a document that was correct six months ago and is not correct now — surfaces as nothing. The vector database query returned fast and returned results; it just returned the wrong ones for the current answer.
- A 500 surfaces as an error rate spike. A hallucinated fact stated in a fluent, well-structured paragraph surfaces as nothing. The model call succeeded, returned tokens within budget, and finished with a normal stop reason.
- A crash surfaces as an availability dip. A prompt-injection-driven policy violation, where the agent follows an instruction embedded in retrieved content instead of its system prompt, surfaces as nothing at the infrastructure layer — the agent executed exactly the tool calls it decided to execute.
The common thread: every one of these is a decision-layer failure, not a request-layer failure. The request completed successfully by every metric APM tracks. The thing that failed was judgment — what the agent chose to say, which tool it chose to call, and whether the source material it reasoned from was actually relevant. None of that has a status code. AI-specific observability exists because someone has to instrument that layer specifically: capture the prompt, the retrieved context, the tool call and its arguments, the model's output, and some means of judging whether that output was actually correct — whether by a human reviewer, an automated evaluator, or a downstream signal like a support escalation.
Side-by-side: the Layered Coverage Model
This table is the article's core argument. Each row is a signal type an AI agent's production behavior can produce. The two right-hand columns mark whether each layer actually covers that signal today, in a typical production deployment.
| Signal type | Traditional APM | AI-specific observability |
|---|---|---|
| Latency (request/response timing) | Covered | Not its focus, though AI observability tools often surface model-call latency too |
| Error rate (4xx/5xx, exceptions) | Covered | Not its focus |
| Uptime / availability | Covered | Not covered |
| Resource usage (CPU, memory, queues) | Covered | Not covered |
| Cost (token spend, per-call and per-task) | Not covered | Covered |
| Output correctness (was the answer right?) | Not covered | Covered |
| Tool-selection quality (right tool, right arguments) | Not covered | Covered |
| Retrieval relevance (was the retrieved context actually useful?) | Not covered | Covered |
| Prompt and output content (what was actually said) | Not covered | Covered |
| Deploy correlation for infra regressions | Covered | Partial, when trace versions are tagged to a release |
Read down the two right columns and the pattern is almost perfectly non-overlapping: the top four rows belong to APM, the middle four belong to AI observability, and only the last row has any real shared ground. That's the whole argument in one table. A team running only APM is not running a worse version of full coverage — it is running exactly half of it, and the half it is missing is the half that decides whether the agent's output can be trusted.
A normal-metrics, wrong-answer incident, worked example
Return to the opening scenario and work it end to end, the way an on-call engineer would actually have to.
Day 0. A support-focused AI agent is deployed behind an API that answers customer questions about refund eligibility by retrieving policy documents and generating an answer. APM dashboards are configured with reasonable alerting: p95 latency under 2 seconds, error rate under 0.5%, uptime target of 99.9%. All three are green at deploy time and stay green.
Day 1. A policy document is updated in the knowledge base: a promotional refund window that used to be 60 days is now 30 days for one product line. The document update itself succeeds without error — it's a normal content change, not a system change, so nothing in the request path is touched and no APM signal moves.
Day 1, afternoon. The agent's retrieval step, for a specific query pattern about that product line, is pulling both the old and new versions of the policy document because the old version was never deprecated in the vector index, only superseded. The retrieval call succeeds, returns results within normal latency, and the model generates a fluent answer citing the friendlier, outdated 60-day window. From APM's perspective, this is a completely unremarkable request: retrieval succeeded, the model call succeeded, the response was returned in 1.1 seconds, status 200.
Day 1–3. Every customer asking about that product line's refund window gets the wrong, more generous answer, consistently and confidently. Some act on it. APM metrics do not move at all during this window, because nothing about the request path changed — the failure is entirely in what was retrieved and what was said, not in whether the retrieval or generation calls succeeded.
Day 3. A support lead notices a pattern in refund disputes tied to that product line and escalates. An engineer pulls up the APM dashboard first, because that's the default first stop for "something's wrong in production" — and finds nothing. Latency, error rate, and uptime are all exactly where they should be. The engineer has to go a level deeper: pull actual traces for the affected queries, read the retrieved context and the generated output, and only then see that two conflicting policy documents were both being retrieved and the model was choosing the wrong one to trust.
Root cause and fix. The old policy document is deprecated from the index, a retrieval-relevance check is added to flag when a query returns semantically conflicting sources, and a correctness eval is added to the regression suite specifically for refund-policy queries so a future document update triggers a re-check.
Nothing in that incident was an APM problem, and no amount of additional APM instrumentation — more granular latency percentiles, tighter error-rate alerting, better resource dashboards — would have caught it, because the underlying signal (two documents disagreeing, and the model silently picking the wrong one) does not reduce to a timer or a status code. It required a layer that could see the retrieved content and the generated output, and a way to judge that content against a correctness standard. That is precisely the layer AI-specific observability instruments.
Field note: The fastest deploy-adjacent way to reproduce a version of this incident in your own stack is not a load test — it's a knowledge-base content change with no downstream re-validation. If your retrieval index can be edited without triggering any check on the agent's output, you have this exposure today, independent of anything your APM stack reports.
A layered architecture: APM and AI observability together
The two layers are not two separate systems that happen to run near each other — they attach to the same request path at different points, and a single request should carry identifiers that let you correlate a decision-layer finding back to the exact infrastructure-layer request that produced it, and vice versa.
Concretely, for one incoming request to an AI agent:
- Entry. APM instrumentation starts a trace span at the request boundary — recording start time, route, and a trace ID — exactly as it would for any HTTP-triggered service.
- Retrieval call. APM records the timing and status of the call to the vector database or search index. AI-specific instrumentation, attached to the same span via the trace ID, records what was retrieved — the actual documents or chunks returned, their relevance scores, and which ones the model ultimately used.
- Model call. APM records latency, status, and (often) token counts for the call to the model provider — this is squarely infrastructure telemetry, since a model API is just another downstream dependency with a status code and a timer. AI-specific instrumentation records the actual prompt sent, the actual completion returned, and any structured output or tool-call decision embedded in it.
- Tool calls. APM records each tool call's latency and whether it errored, the same as any internal service call. AI-specific instrumentation records which tool was chosen, what arguments were passed, and whether that choice was appropriate given the conversation so far.
- Response. APM closes the span, computing total latency and recording the final status code. AI-specific instrumentation attaches an evaluation result to the same trace — from an automated judge, a human reviewer, or a downstream outcome signal — that answers whether the response was actually correct.
The illustrative shape below is not a specific product's schema — it's meant to show, in miniature, how the two kinds of fields sit side by side on one trace rather than in two unrelated systems.
// Illustrative: fields present in APM-style spans vs. AI-specific spans on the same trace.
type ApmSpan = {
  traceId: string;
  route: string;
  startedAt: number;
  durationMs: number;
  statusCode: number;
  dependency?: "model-api" | "vector-db" | "tool";
};

type AiSpan = {
  traceId: string; // same trace ID as the ApmSpan it corresponds to
  prompt?: string;
  retrievedContext?: { source: string; relevanceScore: number }[];
  toolCall?: { name: string; arguments: Record<string, unknown> };
  output?: string;
  evaluation?: { correct: boolean; judge: "human" | "automated"; note?: string };
};
The point of pairing these on a shared traceId is that an incident review should never require choosing which system to open first. A latency spike and a correctness regression can share a root cause — a slow retrieval call that also returned irrelevant documents, say — and you only see that if both layers' data lands on the same trace rather than in two dashboards that don't reference each other.
Do you need both, or can one substitute for the other?
Neither layer substitutes for the other, but the honest answer to "do I need both" depends on what the agent is actually doing and what's at stake when it's wrong.
APM alone is not enough for any agent whose output materially affects a user's decision, money, or account state — because APM cannot tell you the agent was wrong, only that it responded. A support agent quoting policy, a coding agent modifying files, an agent authorizing a refund, or anything summarizing information a user will act on all fall into this category. If the agent can be confidently wrong in a way that costs someone something, you need visibility into whether it actually was.
AI observability alone is not enough either, and for a more mundane reason: an agent that's giving perfectly correct answers but taking 30 seconds to do it, or that's silently OOMing under load, is still a production incident. Correctness tooling doesn't watch memory, doesn't alert on uptime, and generally doesn't localize a regression to a specific downstream dependency the way distributed tracing does. Treating AI-specific tooling as a full replacement for APM just relocates the blind spot instead of closing it.
Where a smaller deployment can reasonably start with less: a low-stakes internal tool, used by a small trusted audience, where a wrong answer is inconvenient rather than costly, can reasonably run with lighter AI-specific instrumentation at first — spot-checked evals rather than continuous ones, for instance — while still keeping baseline APM in place, since infrastructure failure modes don't become less likely just because the stakes of a wrong answer are lower.
Where both layers earn their cost immediately: any agent in a regulated, customer-facing, or financially consequential path. The cost asymmetry matters here — APM is usually already paid for and running; the marginal cost of adding AI-specific observability on top is what should be weighed, not the cost of AI observability against the (already sunk) cost of APM.
Decision rule: If a wrong answer from the agent could cost a user money, time, or a bad decision, add AI-specific observability regardless of how healthy APM looks — a green infrastructure dashboard is not evidence the agent is behaving correctly, only evidence the request path is working.
A buyer evaluation scorecard
If you're assessing whether your current stack is sufficient, work through these questions in order. Each maps to a specific gap this article has covered.
| Question | What a "no" tells you |
|---|---|
| Can you see p95 latency, error rate, and uptime for the agent's full request path today? | If no, you have a baseline APM gap, independent of anything AI-specific. |
| Can you see the actual prompt and output content for a given production request, not just that the call succeeded? | If no, you have no visibility into what the agent said, only that it said something. |
| Can you tell, for a specific past response, whether it was factually correct — without manually re-deriving the answer yourself? | If no, you have no correctness signal, and "the dashboard is green" tells you nothing about quality. |
| Can you see which tool the agent chose and why, separately from whether that tool call itself errored? | If no, a wrong-tool failure will look identical to a healthy request in your current tooling. |
| If retrieval is involved, can you see what was retrieved and how relevant it was to the query? | If no, a stale- or conflicting-source failure (like the worked incident above) is invisible to you. |
| Do your infrastructure traces and your AI-specific traces share a common identifier? | If no, correlating a quality regression to its infrastructure root cause will be slow or impossible after the fact. |
| Is there an evaluation or review step that runs before a knowledge-base or prompt change reaches production, not just after a complaint? | If no, you are relying on users to report quality regressions instead of catching them pre-release. |
A team that answers "yes" to the first two questions but "no" to the middle three has real APM coverage and a real AI-observability gap — which is the most common pattern for teams that adopted an agent by extending an existing service without adding decision-layer instrumentation alongside it.
"Which layer caught it?" — five scenarios
Work through each scenario below and pick which layer would actually have caught the problem before reaching for the answer. The scenarios are fixed; this is meant to build intuition for the coverage boundary, not to test recall of the table above.
Which layer caught it?
Five fixed production scenarios. Pick APM, AI observability, or both, then check the reasoning.
Scenario 1 of 5
An agent's p95 latency spikes from 800ms to 4 seconds for ten minutes during a traffic surge, then recovers on its own.
This is a static reference with five fixed scenarios: choosing an answer reveals locally rendered text. It does not run a model, read production telemetry, or send any data.
If scripting is unavailable in your reader, the same five scenarios and answers are summarized here as a static table.
| Scenario | Correct layer | Why |
|---|---|---|
| p95 latency spikes during a traffic surge, then recovers | APM | Pure timing signal, no content claim involved |
Confidently wrong refund policy for two days, all requests 200 OK | AI observability | Request path healthy; only content/correctness instrumentation catches this |
| Coding agent calls delete instead of rename, no tool errors | AI observability | Tool call succeeds infrastructurally; the choice itself was wrong |
| Vector DB returns 500s on 15% of calls, answers become incomplete | Both | APM catches the error spike and localizes it; AI observability confirms the quality impact |
| Memory climbs for 18 hours until an OOM kill | APM | Resource usage and process health, no correctness dimension |
Protect the boundary: what neither layer does for you
Neither layer, alone or together, replaces a human decision about acceptable risk. AI-specific correctness evaluation — whether automated or human-reviewed — is a sampling and scoring mechanism, not a guarantee that every single production response was checked; most deployments evaluate a sample or use an automated judge with its own error rate, not a perfect oracle. APM's alerting thresholds are tuned estimates, not guarantees that every regression triggers before a user notices. Both layers reduce blind spots; neither eliminates the need for an owner who reviews trends, sets thresholds deliberately, and decides what response a given signal warrants — a hold, a rollback, or an escalation. Treat both layers as evidence sources that support a decision a person still has to make, not as an automated substitute for that decision.
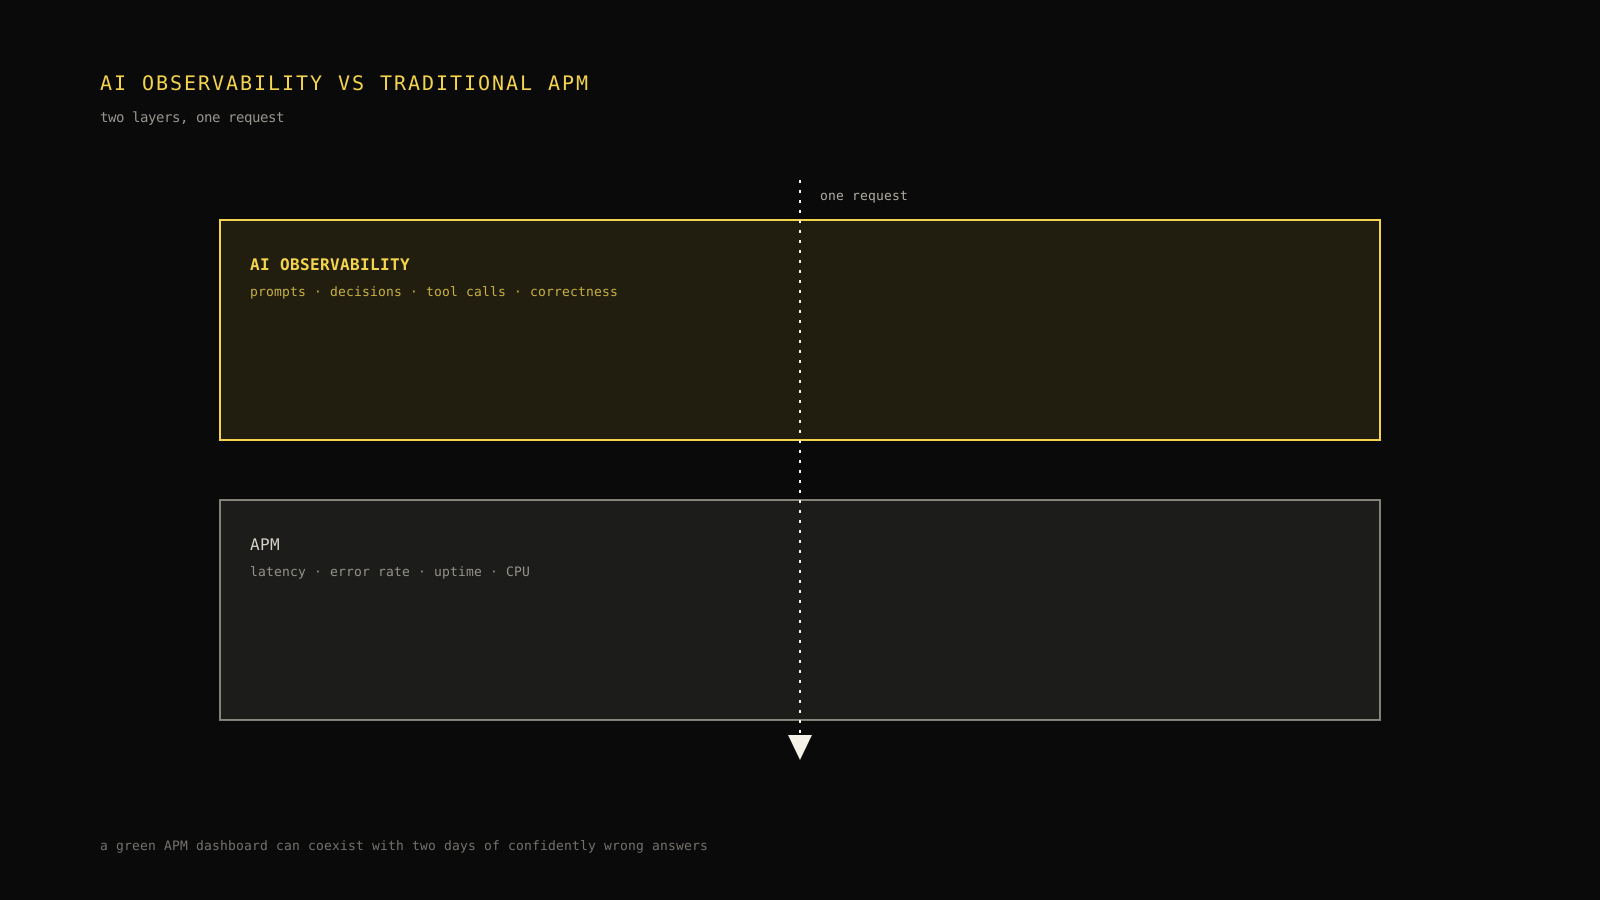
The two-layer architecture, visually

That's the same layered architecture described in the worked example above, drawn as two bands a single request passes through, connected by a shared trace ID. Notice that every span in the lower band has an equivalent status-code-and-timer shape, while every span in the upper band requires reading actual content — that structural difference is why one set of tools was never going to naturally grow into the other.
What changes the recommendation
The guidance above shifts under a few conditions worth naming explicitly. If your agent only performs read-only, low-stakes lookups with no downstream action taken on the answer, the correctness layer's priority drops relative to infrastructure monitoring — there is less at stake in a wrong answer. If your agent's outputs feed directly into an automated action — placing an order, modifying a record, sending a message — the correctness layer's priority rises sharply, because a decision-layer failure now has the same real-world consequence as an infrastructure failure, just without an infrastructure signal to announce it. And if your knowledge base or prompts change frequently, pre-release evaluation matters more than post-incident detection, since the worked incident above shows how much can go wrong between a content change and the point someone notices.
Make the operating decision
If you're deciding how to add AI-specific instrumentation without discarding your existing APM investment, choosing among AI observability tools covers the practical category breakdown, and AI agent monitoring goes deeper on what continuous, production-grade monitoring of an agent's decisions looks like day to day. If you're earlier in the evaluation and still building the case internally, what AI observability is lays the definitional groundwork this article intentionally didn't repeat, and AI observability platform covers the build-vs-buy decision for consolidating both layers.
Leave the reader with the next move
- [ ] Confirm APM already covers latency, error rate, uptime, and resource usage for the agent's full request path.
- [ ] Confirm there is a separate, working way to inspect prompt/output content, tool choice, and retrieval relevance for a given past request.
- [ ] Confirm infrastructure and AI-specific traces share a common trace identifier.
- [ ] Confirm correctness is evaluated before a knowledge-base or prompt change reaches production, not only after a complaint.
- [ ] Assign an owner for each layer's alert thresholds and review cadence.
Run through the buyer scorecard above against your own stack this week — it takes under thirty minutes and will tell you precisely which of the two layers, if either, you're currently missing.
Frequently asked questions
What's the difference between APM and AI agent observability?
APM observes infrastructure and request-level signals like latency, error rate, uptime, and resource usage. AI observability adds visibility into prompts, model decisions, tool calls, retrieval, and output correctness — signals APM's instrumentation was never designed to capture.
Can I monitor an AI agent with just APM?
You can monitor its infrastructure health — whether requests complete, how fast, and whether resources are healthy — but APM alone cannot tell you whether the agent's answers were correct or its tool choices were right.
Is AI observability a replacement for APM?
No. They cover different, mostly non-overlapping signal types, as the Layered Coverage Model in this article shows, and are meant to be used together rather than as substitutes for each other.
What kind of AI agent failure is invisible to standard APM?
A quality failure: a confidently wrong answer, a bad tool choice, or stale or conflicting retrieved context, all of which can occur with completely normal latency and error-rate numbers, as the worked incident in this article shows.
Do small AI agent deployments need both layers?
It depends on risk and scale, but any agent making decisions that matter to users benefits from at least some AI-specific visibility beyond infrastructure metrics alone — a low-stakes internal tool can reasonably start lighter than a customer-facing or financially consequential one.
Practical field notes from the team building Tracify and operating AI agents in production.
Related posts
Next in the loop
AI Agent SLOs and Error Budgets: A Practical Reliability Framework
Keep reading →