AI Agent SLOs and Error Budgets: A Practical Reliability Framework
Uptime SLOs miss most of what makes an AI agent unreliable. A four-indicator model — availability, reliability, quality, efficiency — plus a worked error-budget example and a release-gating policy.
In this guide17 sections
At a glance
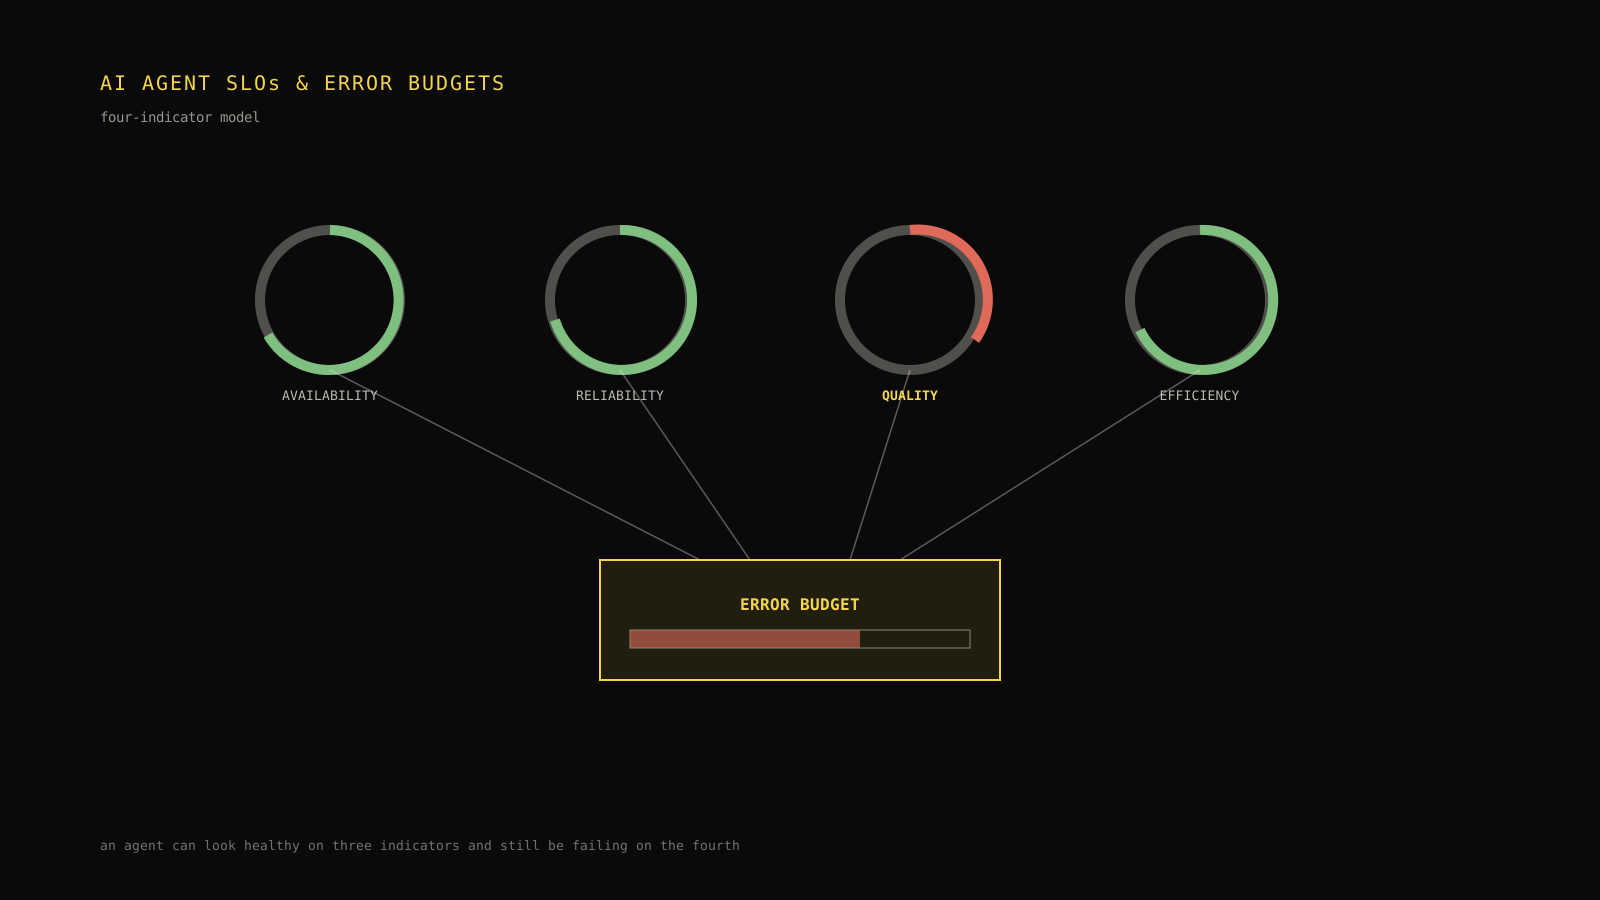
An AI agent SLO framework needs four indicator types, not one: availability (did the agent respond), reliability (did the run complete without erroring, looping, or timing out), quality (was the completed output correct and well-formed), and efficiency (what did a successful task cost in money and time). A team that only tracks availability can hold 99.9% uptime while shipping wrong answers all quarter, because uptime never asks whether the response was correct. An error budget is the acceptable amount of SLO-violating behavior across all four indicators before a team deliberately slows down releases to protect reliability, rather than reactively firefighting after the fact.
This article assumes you already think in SLIs, SLOs, and error budgets for traditional services — it does not re-derive error-budget theory from first principles. What it covers is the part that's different for an agent: which indicators actually catch agent-specific failure, how to write an SLI for something as fuzzy as "quality," and what a release-gating policy looks like when the budget runs out. If you haven't yet named your own agent's failure modes or defined a release process, retries, fallbacks, and guardrails for AI agents and the failure-diagnosis and release-gating material in this cluster are the better starting points; this piece is for teams ready to turn that vocabulary into measurable targets.
The operating model
The Four-Indicator SLO Model organizes every SLI a team should consider into one of four categories, so no single number is asked to carry more meaning than it can hold. Availability and reliability describe whether the system ran; quality and efficiency describe whether it ran well. A team that stops at the first pair has built an infrastructure dashboard, not an agent reliability practice.
| Indicator | Question it answers | Example SLI | Example SLO | Example error-budget policy |
|---|---|---|---|---|
| Availability | Did the agent respond at all? | Proportion of invocations returning any response (success or handled error) within a fixed timeout | A team might target 99.5% over a rolling 30 days | Budget spent: freeze non-critical infrastructure changes until availability recovers for 7 consecutive days |
| Reliability | Did the run complete without erroring, looping, or timing out? | Proportion of runs reaching a terminal non-error state without exceeding a defined retry ceiling | A team might target 97% over a rolling 7 days | Budget spent: pause new tool integrations; require a design review before adding orchestration complexity |
| Quality | Was the completed output correct and well-formed? | Proportion of completed runs passing a defined rubric or schema check on a sampled basis | A team might target 90% rubric pass rate over a rolling 14 days | Budget spent: freeze prompt and model changes; require every change to pass the full eval suite, not a targeted subset |
| Efficiency | What did a successful task cost, in money and time? | Cost and p95 latency per successfully completed task | A team might target a $0.15 ceiling and a 12-second p95 ceiling, both workflow-specific | Budget spent: block model or tool changes that increase cost per successful task until a cost review happens |
Every number in that table is a worked hypothetical, stated that way deliberately. There is no industry-standard "99.9% is the bar" figure for an AI agent, the way there sometimes is for infrastructure uptime — an agent's acceptable failure rate depends entirely on what it does, who it serves, and what a wrong answer costs. Treat every threshold here as a template to replace with your own team's number, not a target to copy.
Why traditional uptime SLOs miss most AI agent failure
A conventional service SLO asks a binary question at the transport layer: did the request succeed, and how fast. That question is well-suited to services where "succeeded" and "correct" are nearly the same thing — a database write either committed or it didn't, a cache either returned the key or it didn't. An LLM call almost always "succeeds" in the transport sense. The model returns 200, the tokens stream back, latency is nominal — and the answer can still be wrong, ungrounded, formatted incorrectly, or the result of the agent calling the wrong tool three times before giving up and guessing.
This is the gap the opening scenario describes. Uptime and quality are orthogonal measurements. An agent can sit at 100% availability and 0% quality simultaneously — every call answered, every answer wrong — and a dashboard built only around infrastructure health will never show it. The inverse is also true: a temporary spike in 5xx errors from an upstream tool can drag availability down while the answers the agent did manage to produce were perfectly correct. Neither number substitutes for the other, which is exactly why the Four-Indicator Model keeps them structurally separate instead of blending them into one health score.

Reliability sits between the two. It is still a "did it run" question, but at a finer grain than raw transport availability: a run can be available (the agent responded) while being unreliable (it looped through the same tool call five times before an operator killed it, or it hit a step-count ceiling and returned a partial result). Reliability failures are frequently the leading indicator of a quality problem — a model that starts looping on a certain input class is often also the model producing degraded answers on adjacent inputs — which is one reason to track them as a distinct SLI rather than folding loop-and-retry behavior into a generic error rate.
Writing an SLI: from vague goal to measurable signal
"The agent should be reliable" and "the agent should give good answers" are goals, not SLIs. An SLI has to be a ratio (or a distribution) computed from data you actually collect, over a window you can defend, using a definition of "good" that someone could audit and disagree with in a specific, falsifiable way.
The construction pattern that works across all four indicator types is the same three-part question:
- What is the population? All invocations, all started runs, all completed runs — the denominator changes what the SLI can claim. An availability SLI's denominator is every attempt, including ones that time out. A quality SLI's denominator should usually be completed runs only, because it makes no sense to score a quality rubric against a run that never finished.
- What counts as good, precisely? "Correct" needs an operational definition — passed a rubric score above a threshold, matched a schema, avoided a defined set of unsafe outputs, was not flagged by a downstream human reviewer. Vague definitions produce SLIs nobody trusts under disagreement.
- Over what window, measured how often? A 7-day rolling window reacts fast but is noisy on low-traffic agents; a 30-day window is stable but slow to reflect a regression. The right window is usually a function of traffic volume, not a fixed convention — pick the shortest window where the SLI's sample size is still large enough to mean something.
Field note: The most common mistake teams make writing their first quality SLI is trying to capture "quality" as a single composite score. Resist it. A composite score of 0.87 that blends correctness, tone, and format compliance can stay flat while format compliance alone quietly collapses — the exact failure a single-metric SLI is least equipped to surface. Track format compliance and correctness as separate SLIs feeding the same indicator category, and let a release gate check both.
Model-specific fields worth an SLI of their own
Not every quality signal deserves a top-level SLO, but several are common enough to name explicitly: schema or output-contract compliance (did the agent's response parse as the format downstream systems expect), groundedness (for retrieval-augmented agents, did the answer stay consistent with retrieved context), and safety-boundary adherence (did the agent avoid actions outside its declared tool-permission scope). Each of these can regress independently of the others, and each has different owners — which is exactly the argument for keeping them as separate, named SLIs rather than one blended "quality score" nobody can act on.
Setting an SLO threshold without historical data
Every SLO eventually needs a number, and the honest answer to "what number" when you have no history is: you don't know yet, and pretending otherwise produces a threshold nobody trusts. The workable approach is to treat the first SLO as explicitly provisional.
- Observe before you commit. Run the SLI in shadow — compute it, chart it, do not gate anything on it — for a defined observation window (two to four weeks is a reasonable starting range for most agents, shorter for high-traffic ones, longer for low-traffic ones where sample size is the constraint).
- Set the first threshold conservatively, and say so out loud. A team might set an initial quality SLO a few points below the median observed during the shadow window, explicitly labeled as a starting point that will be revised, not a commitment carved in stone.
- Revisit on a fixed cadence, not only after an incident. A threshold that only ever gets discussed after it's already been missed stops functioning as a target and starts functioning as a postmortem trigger. Put a calendar reminder on it.
- Separate "we don't know the right number" from "we have no number." A provisional, clearly-labeled 85% quality SLO with a revision date attached is a functioning reliability practice. No quality SLO at all is the scenario in this article's opening.
Error budgets: definition and policy
An error budget is simply 100% minus the SLO, expressed as the amount of failure a system is allowed before a team's operating posture changes. A 97% reliability SLO carries a 3% error budget — three runs out of every hundred are allowed to fail to complete cleanly before the budget is considered spent for that window. What makes an error budget useful isn't the arithmetic; it's the policy attached to spending it. An error budget with no consequence for being exhausted is just a chart nobody acts on.
For an AI agent, the budget policy needs to answer a question traditional SRE practice doesn't: which changes get restricted when which indicator's budget is spent. A spent availability budget and a spent quality budget call for different responses, because they usually have different root causes and different owning teams.
| Budget spent | Likely cause pattern | Recommended action |
|---|---|---|
| Availability budget | Infrastructure, upstream dependency, or rate-limit issue | Freeze infrastructure and dependency changes; incident-review the outage; do not touch prompts or models — they are not the likely cause |
| Reliability budget | New tool integration, orchestration change, or a model version change that altered call patterns | Pause new tool or orchestration changes; require a design review before adding complexity; audit recent retry-policy changes |
| Quality budget | Prompt change, model version change, or upstream retrieval/index change | Freeze prompt and model changes; require the full evaluation suite (not a targeted subset) to pass before any further quality-affecting change ships |
| Efficiency budget | A costlier or slower model swap, a change in tool-call frequency, or retry-driven cost inflation | Block changes that increase cost or latency per successful task; require a cost review before further model or tool changes |
The pattern across all four rows is the same: a spent budget in one indicator restricts the category of change most likely to have caused it, not every change across the whole system. Freezing all releases every time any one indicator dips trains teams to treat the policy as noise and route around it. Freezing the relevant category of change keeps the policy credible and keeps unrelated work moving.
Quality failures vs. infrastructure failures
It's worth naming directly why quality deserves its own budget rather than being folded into reliability. A reliability failure is usually binary and attributable to a specific span — a tool call errored, a step-count ceiling was hit, a timeout fired. A quality failure is often none of those things: the run completed cleanly, every span succeeded, and the final answer was still wrong, outdated, or built on a hallucinated fact the model stated with full confidence. Standard infrastructure monitoring — the kind built for the availability and reliability indicators — has no mechanism to catch this class of failure at all, because nothing in the trace looks unhealthy.
This is also why quality SLIs generally require sampling and scoring (a rubric, an LLM-as-judge pass, a human review queue) rather than the pass/fail span-level logic that reliability SLIs can often use directly. That scoring step has its own cost and latency, which is part of why quality SLO windows in the reference table above tend to run longer (14 days rather than 7) — the sample needed to trust a scored quality number takes longer to accumulate than a simple completion-rate count.
What happens when the budget is spent
The policy table above names the mechanical response — freeze this category of change, require that review. Two things matter beyond the mechanics.
First, the freeze has to be real, not aspirational. If "quality budget spent, prompt changes frozen" is a status a dashboard displays but nothing actually blocks a deploy, the budget is decorative. This is where an SLO framework has to connect to the release process described in this cluster's release-checklist material — a spent budget should be a gate a release pipeline can check, not a policy a team is trusted to remember under deadline pressure.
Second, the freeze has an exit condition, and it should be defined before the freeze happens, not negotiated during it. A reasonable default: the budget is considered recovered once the SLI has held above the SLO for a full window (matching the SLO's own measurement window — 7 consecutive days for a 7-day reliability SLO, for instance), not the instant a single good day appears. Exiting a freeze on one good sample recreates the exact instability the freeze was meant to prevent.
Decision rule: A budget freeze lifts only after the SLI has held above threshold for one full measurement window, and the lift is announced with the data that justified it — never lifted silently, and never lifted on a single good day.
Worked example: an internal support agent's SLO set
Consider a fictional internal support agent — it answers employee questions about expense policy, benefits, and IT requests by retrieving from an internal knowledge base and occasionally calling a ticket-creation tool. Here is one hypothetical, fully worked SLI/SLO/error-budget set for it, illustrating how the Four-Indicator Model applies to one real (if fictional) system rather than staying abstract.
Every number below is invented for this worked example and is not a benchmark.
| Indicator | SLI | SLO | Error budget | What tripped it in month one |
|---|---|---|---|---|
| Availability | % of invocations answered within 8 seconds or with a handled error | 99.5% over 30 days | 0.5% (~108 failed invocations in a 30-day month at moderate traffic) | A 40-minute upstream knowledge-base outage consumed roughly 60% of the month's budget in one incident |
| Reliability | % of runs completing without exceeding a 3-retry ceiling on the ticket-creation tool | 97% over 7 days | 3% of runs | A ticket-tool schema change two weeks in caused a spike in malformed calls, consuming the full weekly budget for 4 straight days |
| Quality | % of a daily-sampled set of completed runs passing a groundedness-plus-format rubric | 90% over 14 days | 10% of sampled runs | A stale knowledge-base index (unrelated to the tool-schema issue) caused answers to cite an expired benefits policy for roughly nine days before it was caught |
| Efficiency | Cost and p95 latency per successfully resolved query | $0.08 ceiling, 6-second p95, both over 7 days | Any week averaging above either ceiling | The retry spike from the reliability incident above also inflated cost per successful task by roughly 35% that week — the two incidents shared a root cause |
The worked example illustrates something the reference table alone can't: budget events cluster. The tool-schema change that spent the reliability budget also spent the efficiency budget in the same week, because retries cost money. The stale-index problem that spent the quality budget was a completely separate root cause running concurrently. A team reading only one indicator would have seen one incident; reading all four surfaced two, with different owners and different fixes — the retrieval-pipeline owner for the stale index, the tool-integration owner for the schema change.
From error budget to release decision
Applying the decision table from earlier to this specific month: the reliability and efficiency budgets being spent in the same week should have frozen new tool and orchestration changes until the schema issue was fixed and reliability held above 97% for a full 7-day window again. The quality budget being spent separately should have frozen prompt and retrieval-adjacent changes until the index was refreshed and the groundedness rubric held above 90% for a full 14-day window. Two independent freezes, two independent recovery conditions, running in parallel — which is exactly the granularity a single blended "reliability score" would have hidden.
SLO design worksheet
Pick an indicator type below to see the worksheet template for it — the SLI definition, a suggested measurement window, an example threshold range, and what that indicator specifically does not catch. Each indicator type needs a structurally different SLI; the point of working through all four separately is noticing that a template built for reliability doesn't transfer cleanly to quality, and vice versa.
SLO Design Worksheet
SLI definition
Proportion of completed runs that pass a defined evaluation bar (a rubric, a groundedness check, or a schema check) on a sampled or fully-scored basis.
Suggested measurement window
Rolling 14-day window, reviewed biweekly alongside the evaluation dataset.
Example threshold range
A team might start around 90% pass rate on a rubric-scored sample and treat that number as provisional until a full release cycle of data exists.
What this indicator does not catch
Quality is rarely one number — a single composite score can hide a schema-format regression behind an unchanged accuracy figure. Track format compliance and correctness as separate SLIs.
This is a static decision aid: selecting an indicator type reveals a fixed worksheet template on this page. It does not call a model, read live telemetry, or store your selection beyond this browser tab. All threshold examples are illustrative starting points, not industry-standard figures.
If the interactive worksheet above isn't available in your reader, the same four templates are summarized in the Four-Indicator Model reference table near the top of this article — each row maps to one worksheet: the SLI column is the definition, the SLO column is the threshold range, and the failure mode each indicator misses is the boundary discussed in the sections above it (availability misses correctness, reliability misses quality, quality alone misses cost, and none of the three catch runaway spend without an efficiency SLI).
Illustrative SLO configuration
The snippet below shows one way to declare an SLI/SLO/error-budget triple per indicator type in a vendor-neutral, YAML-like configuration shape. It is illustrative only — it does not correspond to any specific vendor's schema or a tested production configuration, and field names should be adapted to whatever your own monitoring stack actually supports.
# Illustrative only — not a tested production schema.
slo_set:
  agent: internal-support-agent
  indicators:
    - type: availability
      sli:
        description: invocations answered within timeout, handled errors included
        window_days: 30
      slo:
        target: 0.995
      error_budget:
        policy_on_spend: freeze_infra_and_dependency_changes

    - type: reliability
      sli:
        description: runs completing without exceeding retry ceiling
        window_days: 7
      slo:
        target: 0.97
      error_budget:
        policy_on_spend: pause_new_tool_and_orchestration_changes

    - type: quality
      sli:
        description: sampled completed runs passing groundedness+format rubric
        window_days: 14
        sample_rate: 0.10
      slo:
        target: 0.90
      error_budget:
        policy_on_spend: freeze_prompt_and_model_changes

    - type: efficiency
      sli:
        description: cost and p95 latency per successfully completed task
        window_days: 7
      slo:
        cost_ceiling_usd: 0.08
        latency_p95_seconds: 6
      error_budget:
        policy_on_spend: block_cost_increasing_changes
Diagnose the first divergence
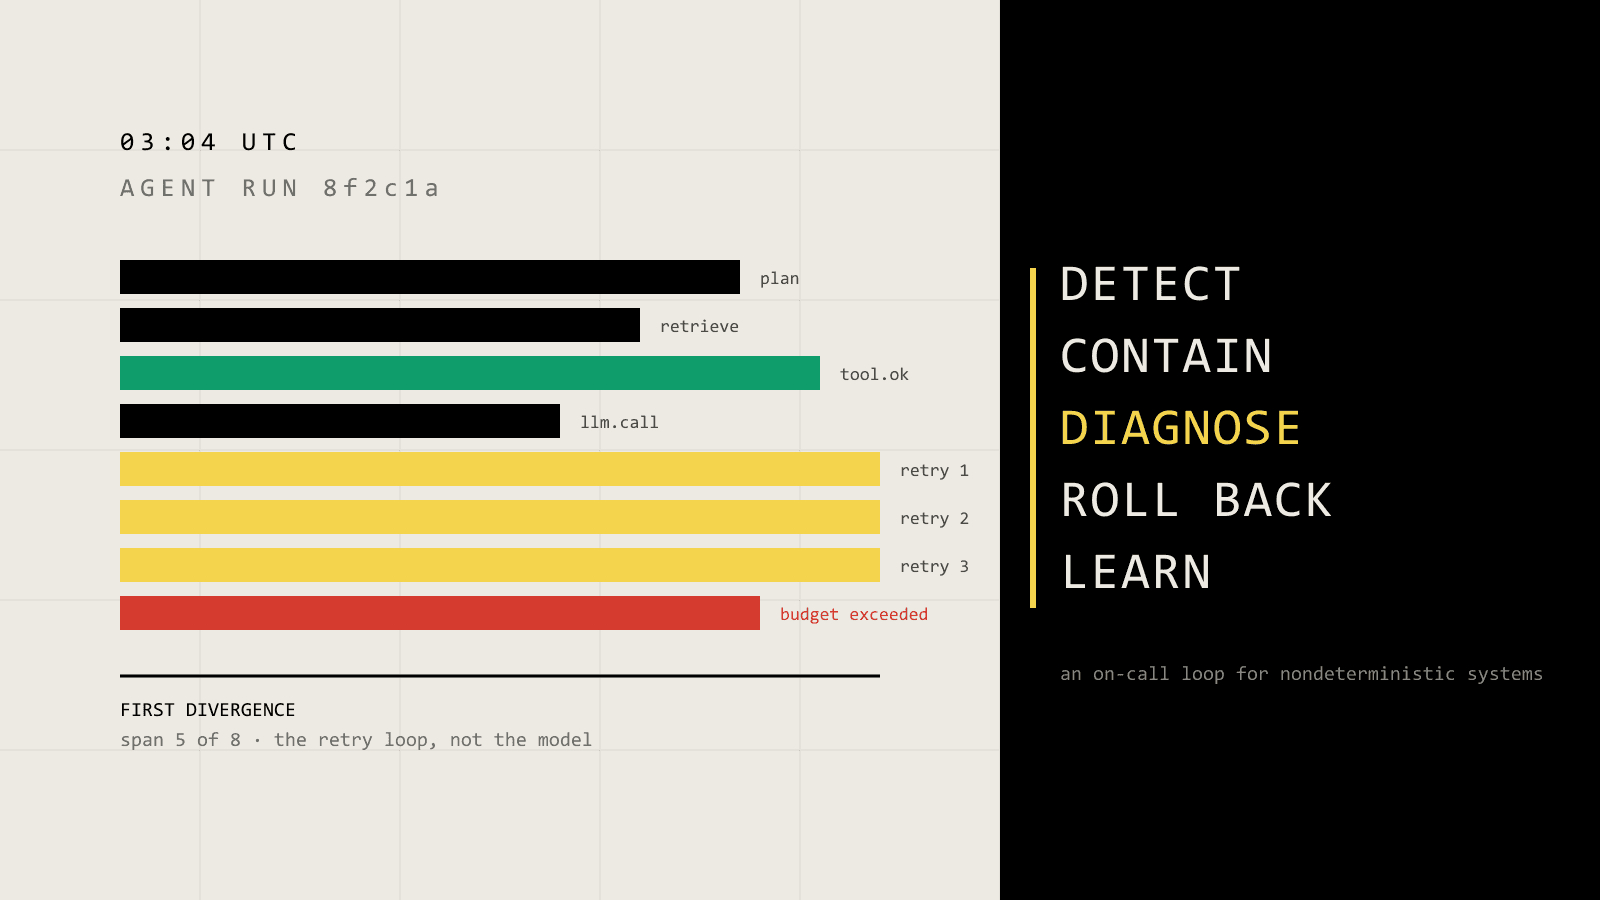
When a budget gets spent, the fastest path to a root cause is usually to ask which indicator moved first, not which indicator is furthest below its SLO right now. A quality regression that started three days ago and is only now dragging the 14-day quality window below threshold will look, on a dashboard glanced at today, less urgent than a reliability dip that started this morning — but the quality regression has had three days to accumulate user-visible harm the reliability dip hasn't. Reading the trend, not just the current value, against each indicator's own window is what separates a useful budget review from a status check.
Compare the meaningful trade-offs
The four indicators are not independent levers a team can optimize freely — they trade against each other in predictable ways. Tightening a quality SLO (raising the rubric bar) often increases retry rate as the agent or its orchestration layer attempts more corrective passes, which pressures the reliability and efficiency budgets. Loosening an efficiency ceiling to allow a more capable, slower model can improve quality while making the latency SLO harder to hold. None of these trade-offs has a universally correct resolution — the right balance point depends on what a wrong answer costs this specific agent's users versus what a slow or expensive one costs, which is a product decision as much as an engineering one.
Do not resolve these trade-offs by collapsing all four indicators into one composite reliability score to "simplify" the dashboard. A composite score can hold steady while quality quietly degrades and efficiency quietly compensates by pushing more traffic through a cheaper, faster path — the exact blended-metric failure mode called out earlier in this article, now at the system level instead of the single-SLI level.
Protect the security boundary
An error-budget policy that restricts what can change has to be enforceable against the same permission and approval boundaries the rest of the system uses — a "prompt changes frozen" policy is meaningless if any engineer can still push a prompt change directly to production without going through the gate that checks budget state. Tie budget-driven freezes to the same release-approval mechanism described in this cluster's release-checklist material, not to a separate, informally-enforced convention. The illustrative YAML above declares a policy per indicator; it does not itself enforce anything — enforcement belongs in whatever release pipeline or approval gate actually controls deploys, and that pipeline is the thing that needs the security review, not the SLO declaration.
Read the lower half visually
The worked support-agent example above showed two independent incidents landing in the same month with different root causes and different owners. The pattern worth internalizing from it: a spent budget in one indicator is a lead, not a full diagnosis — it tells you where to look, not what you'll find. The tool-schema regression and the stale-index regression shared no code path and no owner; only the four-indicator split made both visible in the same review cycle instead of one masking the other inside a blended score.
What changes the recommendation
The Four-Indicator Model assumes an agent with distinguishable availability, reliability, quality, and efficiency concerns — true for most production agents, but not universal. A very low-traffic internal tool may not have enough volume for a 7-day reliability window to mean anything statistically; that team should widen the window before trusting the SLI, not lower the bar to compensate. An agent with no meaningful cost variance (a fixed-price internal deployment with no per-call billing) may reasonably fold efficiency down to a latency-only SLI rather than tracking cost at all. Adapt the model's shape to what the system can actually measure — a fabricated SLI with a real-looking number is worse than an honestly missing one, because it invites false confidence exactly where the team needs skepticism.
Make the operating decision
None of this replaces the retry, fallback, and containment mechanics covered in retries, fallbacks, and guardrails for AI agents — SLOs tell you whether a system is behaving within acceptable bounds; guardrails and retry policy are part of how it stays there. Nor does it replace the trace-first triage discipline in AI agent incident response, which is what a team actually runs the moment a budget event fires an alert. The Four-Indicator Model is the target-setting layer those two practices operate against — and it depends on the same run-level metrics discussed in the observability metrics that matter and the monitoring setup covered in AI agent monitoring actually being collected before any of these SLIs can be computed at all.
Leave the reader with the next move
- [ ] Every indicator category (availability, reliability, quality, efficiency) has at least one named SLI, not just availability.
- [ ] Every SLO threshold is either backed by an observation window or explicitly labeled provisional with a revision date.
- [ ] Every indicator's error-budget policy names the specific category of change it restricts when spent, not a blanket freeze.
- [ ] The budget-spent freeze is enforced by the actual release/deploy gate, not left to convention.
- [ ] The recovery condition for each freeze (a full measurement window above threshold) is written down before the freeze happens.
Start with one indicator you don't currently measure — for most teams that's quality, since availability and reliability are the ones existing infrastructure monitoring already gives you for free. Shadow-measure it for a few weeks, set a provisional threshold, and attach one real consequence to it being spent before calling the SLO "live."
Frequently asked questions
What is an SLO for an AI agent?
A measurable target for how reliably an agent performs across availability, reliability, quality, and efficiency indicators — not just whether its API responds. A target on any one of the four alone is an incomplete SLO set.
Is uptime enough to measure AI agent reliability?
No. An agent can be fully available and still produce wrong or unsafe outputs, which uptime alone cannot detect — it only measures whether the agent responded, not whether the response was correct.
What is an error budget?
The acceptable amount of SLO-violating behavior allowed before a team deliberately slows down releases to focus on reliability, rather than reacting only after user-visible harm accumulates.
Can AI quality be captured by one metric?
No. Quality typically needs multiple SLIs — such as correctness, groundedness, and format compliance — rather than a single blended score, because a composite number can stay flat while one component quietly regresses.
How do you set an SLO threshold with no historical data?
Start with a conservative estimate from a short observation period, treat it as explicitly provisional, and revise it on a fixed schedule once real distribution data exists — never present a first-guess threshold as a permanent commitment.
Practical field notes from the team building Tracify and operating AI agents in production.
Related posts

Next in the loop
AI Agent Trace Schema: What to Capture for Debugging, Evaluation, and Cost Analysis
Keep reading →