AI Agent Trace Schema: What to Capture for Debugging, Evaluation, and Cost Analysis
A practical run/trace/span/event data model for AI agents, with the required and optional fields that make one schema support debugging, evaluation, and cost analysis at once.
In this guide13 sections
A team notices their agent got expensive last week and opens their logs to find out why. The logs have prompts and completions for every call — plenty to debug a wrong answer. But there is no per-call cost field, so nobody can say which calls drove the spike. There is no correlation ID, so a model call and the three retries it triggered look like four unrelated events instead of one story. There is no captured tool-call argument, so nobody can tell whether a search tool started firing on irrelevant queries. The debugging data existed. The cost data and the evaluation data did not, because the schema was designed around one use case — reading a transcript after the fact — and nothing else.
This article gives you a practical minimum trace schema for AI agents: a run/trace/span/event data model, the required and optional fields for the span types you'll actually see (model call, tool call, retrieval), the correlation and versioning fields that make releases and retries legible, and a redaction boundary so the schema stays useful without becoming a liability. It is not an official or industry-standard specification — there is no single standard for AI agent tracing today — it is a concrete, opinionated starting point you can copy, adapt, and extend once a real question demands a new field.
Run, trace, span, and event: definitions
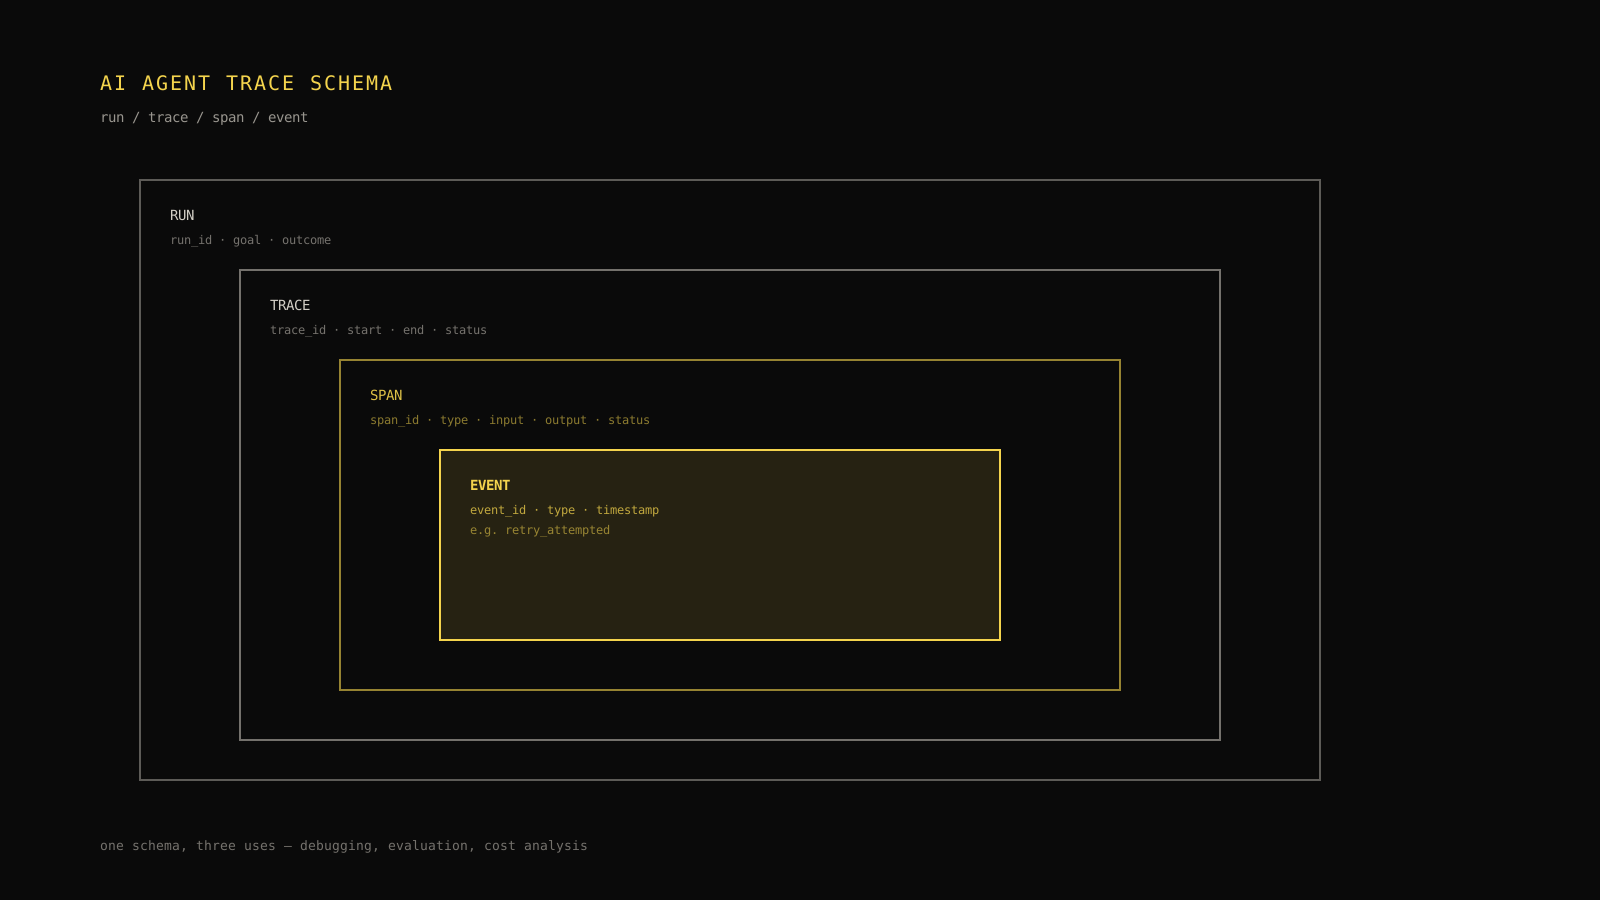
Before any field list makes sense, the four levels of the model need a working definition. Different tools use different names for these — "run" and "trace" in particular get used interchangeably across vendors — so this section fixes the vocabulary this article uses and then holds to it.
- Run. The top-level unit of work with a business meaning: a user asked a question, a ticket needs triage, a scheduled job needs to execute. A run has a goal, an initiator (a user or a system), and an outcome (completed, failed, escalated). A run is what a product manager or support lead would ask about — "how did that run go" — not what an engineer instruments directly.
- Trace. One end-to-end execution of a run: the full path from the first model call through every tool call, retrieval, retry, and final output. In the common case a run has exactly one trace. A run can have more than one trace when a user retries the same request, or when a system automatically re-executes a failed run — in both cases each attempt gets its own trace, but they can share a run ID so the relationship survives.
- Span. One operation inside a trace: a single model call, a single tool call, a single retrieval query, a single human-approval step. Spans nest — a model call span is often the parent of the tool call span it triggered — and each span has its own timing, status, and a type-specific set of fields covered in the next three sections.
- Event. A discrete occurrence inside a span that doesn't deserve its own timing and status but is still worth recording: a retry attempt, a rate-limit backoff, a partial-output flush during streaming, a guardrail check that fired. Events are lightweight annotations on a span, not operations with their own duration.
This is deliberately a naming convention, not a vendor claim. OpenTelemetry uses "trace" and "span" with broadly compatible meanings; if you're building on an OpenTelemetry-based pipeline, OpenTelemetry for LLM tracing covers how spans, context propagation, and semantic conventions map onto this model concretely. This article stays one level up: what a span should contain, independent of the transport.
Why a data model matters before you pick a tracing tool
It's tempting to skip straight to picking a tracing vendor or an OpenTelemetry exporter and let the tool's default schema decide what gets captured. That ordering causes the exact failure in the opening scenario: whatever the default schema optimizes for is the only thing you'll be able to answer later, and defaults optimize overwhelmingly for debugging — prompts, completions, timestamps — because that's the first thing anyone needs when an agent is new.
Cost analysis and evaluation are usually added later, as afterthoughts, which is why they're so often missing when someone actually needs them. LLM tracing explained makes the case for tracing as a practice; this article assumes you already believe that and instead answers the narrower, more concrete question a lot of teams skip: given that you're going to trace, what specific fields belong on each span so you don't have to re-instrument six months from now?
A data model decided up front also makes the tool choice easier, not harder — you can evaluate any tracing product or self-built pipeline against "can it store and query these fields" instead of discovering gaps after migrating.
Required fields for every span
Every span, regardless of type, needs a baseline of fields that make it identifiable, orderable, and attributable. The table below marks which fields are required on literally every span and which are commonly useful but not load-bearing.
| Field | Required | What it's for |
|---|---|---|
span_id | Yes | Uniquely identifies this operation within the trace |
parent_span_id | Yes (nullable for the root span) | Reconstructs the call tree; without it, spans are an unordered bag |
trace_id | Yes | Groups this span with every other span in the same execution |
type | Yes | Distinguishes model call, tool call, retrieval, approval, and other span kinds |
started_at / ended_at | Yes | Duration and ordering; required for latency analysis and for reconstructing a timeline |
status | Yes | ok, error, or a more specific terminal state; the first thing a debugger checks |
retry_of | Recommended | Nullable pointer to the span this one is retrying; without it, retries look like unrelated failures |
attributes (free-form) | Recommended | An escape hatch for context-specific metadata that doesn't warrant a first-class field yet |
Two of these deserve emphasis because they're the ones teams most often skip. parent_span_id is what turns a flat list of operations into an actual call tree — without it you can tell that a model call and a tool call both happened, but not that the tool call happened because of that specific model call's decision. And status needs to be a real terminal state, not just "no error was thrown." A tool call that returned 200 OK with an empty or malformed result is not the same as one that returned the expected data, and if status only tracks HTTP-level success, that distinction disappears.
The three uses, one schema idea
The core claim of this article is that the same span-level fields, captured once, can answer three different questions instead of requiring three separate logging systems:
- Debugging asks: what happened, in what order, and why did it diverge from the expected path? It needs inputs, outputs, timing, status, and retry relationships.
- Evaluation asks: was the outcome correct, and does this run belong in a regression suite? It needs the same inputs and outputs, plus a way to tie the run back to a prompt or model version so a score is comparable across releases.
- Cost analysis asks: what did this run cost, and where did the money go? It needs per-span cost, token counts, and — critically — the retry and failure fields, because a retried or failed span still costs money without producing a successful outcome.
None of these three jobs need their own schema. They need three different views into fields that were already captured because they were cheap to capture at call time and expensive to reconstruct after the fact.

Model-call-specific fields
A model-call span is usually the most information-dense span in a trace, and it's the one most teams already log reasonably well — the gaps tend to be in cost and versioning fields, not in the prompt/completion basics.
| Field | Required | Optional | Notes |
|---|---|---|---|
model | Yes | Full model identifier, including version where the provider exposes one | |
input (prompt or message list) | Yes | Subject to the redaction rules in the privacy section below | |
output (completion) | Yes | Same redaction rules apply | |
prompt_tokens / completion_tokens | Yes | Needed for cost reconstruction independent of a stored dollar figure | |
cost_usd | Yes | Store a computed cost if your pricing is stable; otherwise recompute from tokens at query time | |
temperature / other sampling params | Yes | Useful for reproducing or explaining non-deterministic output differences | |
finish_reason | Yes | Distinguishes a natural stop from a length cutoff or a content filter, which changes the diagnosis | |
system_prompt_ref | Yes | A pointer to a versioned prompt rather than inlining the full system prompt on every span |
finish_reason is worth calling out specifically: a response that was truncated by a token limit and a response that stopped naturally can look identical in a plain transcript, but they point to completely different fixes — one is a context-budget problem, the other might be a genuine model error. Context window management goes deeper on the budget side of that specific failure if it turns out to be the cause.
Tool-call-specific fields
Tool calls are where debugging value and evaluation value diverge most from cost value, because the interesting question for debugging ("did the agent pick the right tool with the right arguments") is almost orthogonal to the interesting question for cost ("did this external call have its own billable cost, separate from tokens").
| Field | Required | Optional | Notes |
|---|---|---|---|
tool_name | Yes | The specific tool or function invoked, not just "tool_call" as a category | |
arguments | Yes | The actual parameters passed; this is the single most useful field for diagnosing a tool-selection or argument-construction failure | |
result_summary | Yes | A bounded summary of what the tool returned, not necessarily the full raw payload | |
status | Yes | Distinct from the model call's status — a tool can fail (timeout, 4xx, 5xx) independent of the model call that triggered it | |
api_cost_usd | Yes | Some tools have their own per-call cost (a paid search API, a metered internal service) separate from model token cost | |
retryable | Yes | Whether this specific failure class is safe to retry automatically, which differs by tool | |
side_effect (boolean) | Yes | Flags whether the call had a real-world effect (sent an email, issued a refund) versus being read-only, which matters for both debugging and guardrail auditing |
Capturing arguments is the single highest-leverage field on this list and the one most often missing in schemas that were only designed around model calls. Without it, a tool-selection failure ("the agent called the wrong tool") and a tool-execution failure ("the agent called the right tool with bad arguments") are indistinguishable from the trace alone — you'd have to guess from the result.
Retrieval-specific fields
Retrieval spans are modeled as a specific span type with their own optional fields, not as a separate schema — the run/trace/span/event model doesn't change for RAG workflows, only the attributes attached to this one span type do.
| Field | Required | Optional | Notes |
|---|---|---|---|
query | Yes | The actual query sent to the retrieval system, which may differ from the user's raw input after rewriting | |
result_count | Yes | How many documents or chunks were returned | |
top_result_ids | Yes | Identifiers for the returned documents, useful for reproducing a retrieval without re-storing full document text | |
similarity_scores | Yes | Ranking scores for the returned results, useful for distinguishing a genuine miss from a low-confidence match that was used anyway | |
index_version | Yes | Which version of the index served this query; critical when diagnosing "stale retrieval" after a re-index | |
filters_applied | Yes | Any metadata filters (tenant, date range, document type) that scoped the query |
index_version matters more than it looks. A retrieval span with no evidence of which index snapshot answered a query makes it impossible to tell a genuine retrieval miss apart from a stale-index problem after a re-index has already happened — the two look the same from a bare "empty" or "irrelevant" result unless the version is recorded at query time, not reconstructed later from an index changelog that may have moved on.
Field note: A retrieval span with a non-empty
result_countbut lowsimilarity_scoresacross the board is a different failure from an empty result set, and it deserves a different owner. An empty result is usually an indexing or filter problem; low-confidence results that still got used are usually a prompt or decision-threshold problem. The trace can only tell you which one happened if the scores were captured.
Correlation, versioning, and release metadata
The fields above make a single span legible on its own. This section covers the fields that make a collection of spans legible together — across retries, across a release, and across the many runs an evaluation or a cost report needs to aggregate.
| Field | Level | Purpose |
|---|---|---|
trace_id | Span | Groups every span belonging to one execution |
correlation_id | Run/Trace | Ties together multiple traces that represent the same logical attempt — for example, a user-initiated retry that starts a fresh trace but should still be recognized as "the same request, try two" |
retry_of | Span | Points a retried span at the attempt it's retrying |
prompt_version | Trace | Which prompt template version produced this trace, independent of the model |
model_version | Span | The exact model identifier and version, since providers change default behavior across versions with the same name |
release_id | Trace | Which deployed release/config generated this trace, so a regression can be isolated to a specific rollout |
dataset_version | Trace (eval context only) | Which evaluation dataset version, if any, this trace was scored against |
A correlation_id earns its own field distinct from trace_id because the two answer different questions. trace_id says "these spans are part of the same execution." correlation_id says "these separate executions are part of the same logical request" — which matters when a user retries manually, when a system automatically re-runs a failed job as a new trace, or when a multi-step workflow spans more than one trace by design. Without it, three attempts at the same underlying task look like three unrelated runs in any aggregate report, which quietly inflates run counts and hides the real retry rate that AI agent cost per task analysis depends on getting right.
prompt_version, model_version, and release_id together are what make a release decision possible from trace evidence alone. Without them, "did the new prompt regress quality" is a question you can only answer by trusting a deploy timestamp to line up with a change in behavior — which breaks the moment two changes ship close together.
Privacy, redaction, and retention boundaries
A schema that captures full prompts and completions by default is the right starting point for debuggability — omitting them "for safety" mostly just means nobody can debug anything, which trades a privacy problem for a reliability problem without actually solving the privacy problem. The better default is to log full content and apply redaction to specific known-sensitive fields before storage, not to omit fields wholesale.
| Field or field class | Sensitivity | Default handling |
|---|---|---|
| Free-text user input (prompts) | Medium — may contain names, account details, or free-form PII | Log in full; apply automated PII detection and redaction before long-term storage |
| Model completions | Medium — same risk profile as input | Same as input |
| Tool call arguments | High when the tool touches payment, identity, or health data | Redact known-sensitive argument keys (SSNs, card numbers, secrets) at the point of capture, not after storage |
| Tool result payloads | High if the tool returns customer records | Store a bounded summary by default; keep full payloads only behind a stricter retention and access policy |
| Authentication tokens, API keys, secrets | Critical | Never log; scrub at the SDK/instrumentation layer before a span is ever constructed |
| Retrieval document content | Variable — depends on what's indexed | Store document identifiers and scores by default; fetch full content on demand from the source system rather than duplicating it into trace storage |
| User and account identifiers | Medium | Log as opaque IDs; keep the mapping to real identities in a separate, access-controlled system |
Retention is a related but distinct decision, and there's no universal answer to how long traces should be kept — it depends on your debugging window, storage cost, and whatever data-handling policy your organization or regulatory environment requires. A practical starting point is to set two windows deliberately rather than by default: a short, full-fidelity window (days to a few weeks) where every field including redacted-but-recoverable content is available for active debugging, and a longer, aggregate-only window where individual traces are dropped but the summary statistics they fed into (cost totals, evaluation scores, error rates) are retained. Treat both windows as decisions to write down and revisit, not defaults to leave unexamined.
Note: None of this is legal or compliance advice. If your traces touch regulated data — health records, payment details, data covered by a specific privacy regulation — involve your own legal or privacy function in setting the actual redaction rules and retention windows. This section describes an engineering starting practice, not a compliance guarantee.
An illustrative trace schema (JSON)
The document below is one illustrative trace: a run with a single trace containing a model-call span and the tool-call span it triggered. It is not a real Tracify internal schema and it has not been validated against any specific tracing library's wire format — it exists to make every field discussed above concrete in one place.
{
  "run_id": "run_8f2a1c",
  "goal": "Answer a billing question from account context",
  "user_id": "usr_4471",
  "outcome": "completed",
  "trace_id": "trc_9b7e0d",
  "correlation_id": "corr_3d5f88",
  "prompt_version": "billing-agent@2026-08-30",
  "release_id": "rel_1042",
  "spans": [
    {
      "span_id": "spn_01",
      "parent_span_id": null,
      "type": "model_call",
      "model": "gpt-billing-4o-mini",
      "input": "Customer asks why they were charged twice.",
      "output": "Calling refund-lookup before answering.",
      "started_at": "2026-08-30T14:02:01.100Z",
      "ended_at": "2026-08-30T14:02:01.900Z",
      "status": "ok",
      "retry_of": null,
      "prompt_tokens": 612,
      "completion_tokens": 84,
      "cost_usd": 0.00041
    },
    {
      "span_id": "spn_02",
      "parent_span_id": "spn_01",
      "type": "tool_call",
      "tool_name": "refund-lookup",
      "arguments": { "account_id": "acct_2291" },
      "result_summary": "2 refunds found, both settled",
      "started_at": "2026-08-30T14:02:02.010Z",
      "ended_at": "2026-08-30T14:02:02.640Z",
      "status": "ok",
      "retry_of": null,
      "api_cost_usd": 0.0002
    }
  ],
  "eval_score": 0.94,
  "eval_dataset_version": "billing-cases@14",
  "total_cost_usd": 0.00061
}
Notice that nothing in this document is duplicated across debug, evaluation, and cost use cases — arguments and result_summary serve debugging and evaluation at once, cost_usd and api_cost_usd serve cost analysis without needing a separate cost-only export, and correlation_id/release_id serve both debugging (which release caused this) and evaluation (is this comparable to a prior release's score). That overlap is the point: a well-designed schema does not need three separate logging paths to answer three separate questions.
Using the schema for debugging vs. evaluation vs. cost
Walk the same document through three different jobs to see how the same fields get read differently depending on the question being asked.
Debugging an unexpected answer starts at spn_01.output, which shows the model decided to call refund-lookup before answering. From there, spn_02.arguments confirms the correct account was queried, and spn_02.result_summary shows two settled refunds were found — so if the final answer to the customer was wrong, the bug is downstream of retrieval, most likely in how the model interpreted "settled" versus "pending." The retry_of: null fields on both spans also rule out a retry-related explanation immediately, narrowing the investigation.
Evaluation cares less about the internal call path and more about eval_score, eval_dataset_version, and prompt_version together: this run scored 0.94 against dataset version 14 under prompt version billing-agent@2026-08-30. A comparison against the same dataset version under a prior prompt version is a valid regression check; a comparison against a different dataset version is not, which is exactly why eval_dataset_version is a required field for any run that participates in evaluation rather than an optional afterthought.
Cost analysis sums cost_usd and api_cost_usd into total_cost_usd, and — more importantly for the kind of investigation that opened this article — checks retry_of across every span in the run. Zero retries here means this run's full cost is attributable to a single successful attempt. A run with two retried model-call spans before the successful one would show a total_cost_usd roughly three times higher for the same successful outcome, which is invisible from cost_usd alone on the final successful span and only becomes visible once retried spans are counted, not discarded. That's the same distinction AI agent cost per task treats as the core reason cost-per-run and cost-per-successful-task diverge.
Trace-Field Explorer
Toggle between the three jobs below. The same illustrative trace document stays fixed — only which fields are highlighted changes, showing which subset of the schema each job actually reads.
{"run_id": "run_8f2a1c","goal": "Answer a billing question from account context","user_id": "usr_4471","outcome": "completed","trace_id": "trc_9b7e0d","correlation_id": "corr_3d5f88","prompt_version": "billing-agent@2026-08-30","release_id": "rel_1042","spans": [{"span_id": "spn_01","parent_span_id": null,"type": "model_call","model": "gpt-billing-4o-mini","input": "Customer asks why they were charged twice.","output": "Calling refund-lookup before answering.","started_at": "2026-08-30T14:02:01.100Z","ended_at": "2026-08-30T14:02:01.900Z","status": "ok","retry_of": null,"prompt_tokens": 612,"completion_tokens": 84,"cost_usd": 0.00041},{"span_id": "spn_02","parent_span_id": "spn_01","type": "tool_call","tool_name": "refund-lookup","arguments": { "account_id": "acct_2291" },"result_summary": "2 refunds found, both settled","started_at": "2026-08-30T14:02:02.010Z","ended_at": "2026-08-30T14:02:02.640Z","status": "ok","retry_of": null,"api_cost_usd": 0.0002}],"eval_score": 0.94,"eval_dataset_version": "billing-cases@14","total_cost_usd": 0.00061}
This is one static illustrative trace document. Switching the toggle only changes which fields are highlighted locally in your browser — it does not call a model, fetch live telemetry, or alter the document. If scripting is unavailable, the same mapping is explained in the required-vs-optional field tables above.
If the interaction above doesn't render in your context, the same idea works as three annotated reads of the identical document: a debugging pass highlights input, output, arguments, result_summary, status, and the timing fields; an evaluation pass highlights eval_score, eval_dataset_version, prompt_version, and outcome; a cost pass highlights every *_tokens, *_cost_usd field, and every retry_of across the trace. None of the three passes requires a different document — only a different lens on the one you already have.
What this schema deliberately leaves out
A practical minimum is not a complete schema, and naming what's out of scope matters as much as what's in. This model does not define a scoring methodology for eval_score — that's a separate decision covered by evaluation-metric design, not a tracing concern. It does not define how spans get exported to a specific backend or how context propagates across process boundaries — that's the transport layer, and OpenTelemetry for LLM tracing is the more useful reference if you're building on OTel conventions specifically. It does not define MCP-specific span shapes for tool servers that speak the Model Context Protocol — the MCP observability guide covers what changes when tool calls cross an MCP boundary. And it does not resolve every field you'll eventually need: a multi-agent workflow, a human-approval step, or a streaming response each tend to need one or two additional fields once you hit them in practice, which is exactly why this is framed as a minimum to extend, not a ceiling to enforce.
The test for whether a new field belongs in your schema should stay the same one this article has used throughout: does it help someone debug a real failure, compare a real release, or attribute a real cost? If the answer is no for all three, it's speculative instrumentation, and it's usually cheaper to add it later — once a real question demands it — than to carry it unused from day one.
Checklist before you ship an instrumentation change
- [ ] Every span has
span_id,parent_span_id,trace_id,type,started_at/ended_at, and a real terminalstatus. - [ ] Retries are recorded as sibling spans linked by
retry_of, never as an overwritten single span. - [ ] Every span type that can incur cost (model call, tool call with a metered API) records enough to reconstruct that cost independently.
- [ ]
correlation_id,prompt_version, andrelease_idare present wherever a release decision or a retry investigation might need them. - [ ] Known-sensitive fields (secrets, payment details, identity documents) are redacted at the point of capture, not after storage.
- [ ] A retention window has been chosen deliberately for full-fidelity traces and for aggregate-only history, and written down somewhere a reviewer can find it.
- [ ] The schema has been checked against a real debugging question, a real evaluation comparison, and a real cost report — not just reviewed on paper.
Once your traces carry this baseline, debugging a wrong answer, scoring a release against a dataset, and explaining a cost line item stop being three separate instrumentation problems and become three different queries against the same evidence. If you want to see what a schema like this looks like once it's actually rendered as a navigable trace rather than a JSON document, the Trace Viewer is the place to check that against a live run.
Frequently asked questions
What is the difference between a trace and a span?
A trace is one end-to-end execution of a run, covering everything from the first model call to the final output. A span is one operation inside that execution, such as a single model call, tool call, or retrieval query. A trace is made of one or more spans; a span never spans across traces.
Should you log full prompts and completions?
Generally yes, for debuggability. The better default is to log full content and apply redaction to specific known-sensitive fields before storage, rather than omitting the fields entirely — omission trades a privacy problem for a debugging problem without actually solving the privacy problem.
What is a correlation ID?
An identifier that ties together retries, fallbacks, and related traces that represent the same logical request, so they can be reconstructed as one story later even if each attempt technically produced its own trace.
Do you need a different schema for RAG agents?
No. Retrieval is modeled as a specific span type with its own optional fields — query, result count, similarity scores, index version — inside the same run/trace/span/event model, not as a separate schema.
How long should traces be retained?
There's no universal answer. Retention should be set deliberately based on your debugging window, storage cost, and data-handling policy — a common pattern is a short full-fidelity window for active debugging and a longer aggregate-only window for historical reporting — rather than left as whatever a vendor defaults to.
Practical field notes from the team building Tracify and operating AI agents in production.
Related posts


Next in the loop
AI Observability Metrics That Matter: Latency, Cost, Quality, and Reliability
Keep reading →