OpenObserve vs Tracify: Unified Infrastructure Observability vs LLM-Specific Observability
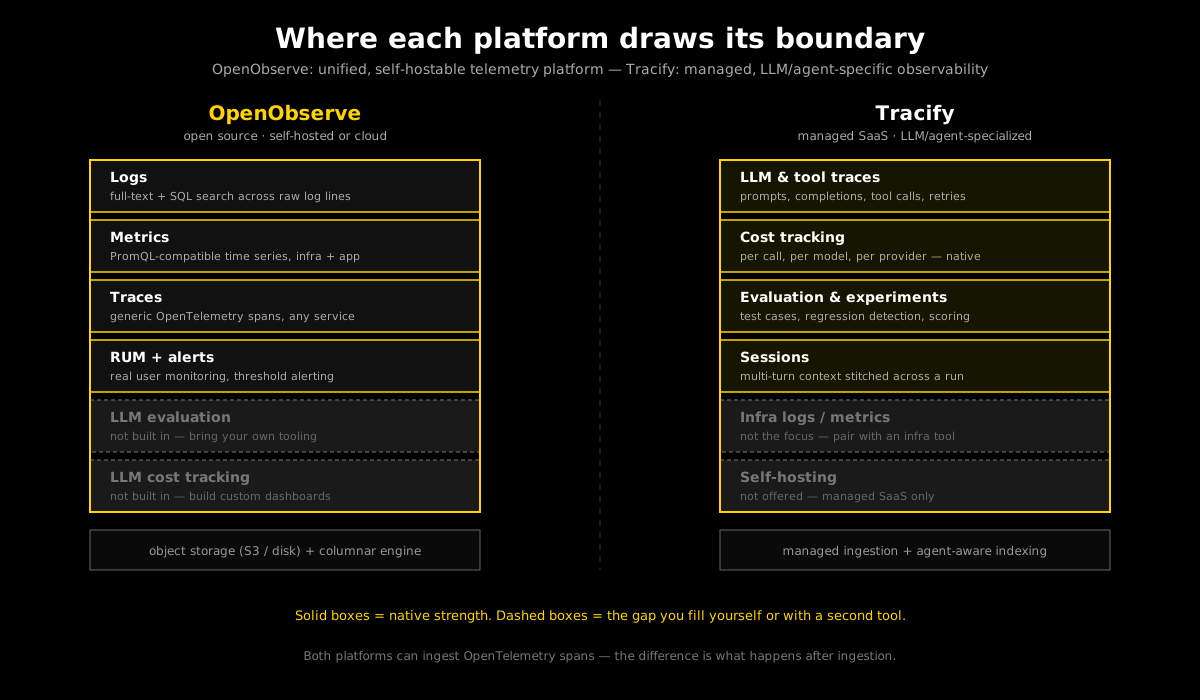
OpenObserve is a self-hostable, open-source platform for logs, metrics, and traces across your whole stack. Tracify is a managed platform built only for LLM and agent observability. Here is how to tell which job you actually have.
In this guide12 sections
At a glance
| Dimension | OpenObserve | Tracify |
|---|---|---|
| Model | Open-source, self-hosted or OpenObserve Cloud | Managed SaaS only |
| Primary scope | Logs, metrics, traces, RUM — any workload | LLM/agent traces, cost, evaluation, sessions |
| Data model unit | The span, log line, or metric sample | The agent trace (a complete interaction) |
| LLM/agent-specific tracing | Generic OpenTelemetry spans only | Prompt, completion, tool call, and retry aware |
| Evaluation framework | Not built in | Integrated: test cases, scoring, regression detection |
| Cost tracking (LLM/provider) | Not built in | Native, per call, per model, per provider |
| Infrastructure monitoring | Native, first-class | Not the product — pair with an infra tool |
| Self-hosting / data residency | Yes, full control | No, SaaS only |
| Query surface | SQL and PromQL over raw telemetry | Agent-aware dashboards and trace search |
| Setup for LLM observability | Custom instrumentation and dashboards | SDK + API key, agent-aware out of the box |
| Best for | Teams that need one platform for everything with a timestamp | Teams whose hardest observability problem is their agents |
OpenObserve answers "what happened across my systems." Tracify answers "why did this agent do that, and what did it cost." They overlap at the trace layer and diverge everywhere else.
The operating model
Every observability platform picks a unit of value — the thing it indexes, bills, and builds its query language around. That choice explains almost everything else about how the platform behaves.
OpenObserve: one pane for everything with a timestamp
OpenObserve treats logs, metrics, and traces as three related but independently valuable streams. It is built as a single Rust binary that ingests OpenTelemetry data (and several legacy formats) and stores it in a columnar format on object storage — S3, GCS, MinIO, or local disk. That storage choice is the platform's core bet: because compressed columnar storage on cheap object storage costs a fraction of what a traditional Elasticsearch or time-series database cluster costs per gigabyte, OpenObserve can offer generous retention without the storage bill that usually forces teams to sample or truncate.
The query surface reflects the same generalist design: SQL over logs and traces, PromQL-compatible queries over metrics, and dashboards that can mix all three. Nothing in the schema knows that a particular span represents an LLM call versus a database query versus a cache miss — they are all just spans with attributes. That is a strength for infrastructure monitoring, where the whole point is correlating a slow checkout API with a saturated connection pool and a spike in 5xx logs, all in the same query.
This positioning is also why teams reach for OpenObserve in the first place: it is commonly adopted as a single-binary replacement for running Elasticsearch or Loki for logs, Prometheus for metrics, and Jaeger or Tempo for traces as four separate systems with four separate operational surfaces. Consolidating those into one ingestion path, one storage layer, and one query language is a meaningful reduction in operational complexity even before agents enter the picture, and it is the reason platform teams evaluate it independent of any LLM workload at all.
Tracify: the agent interaction is the unit of value
Tracify starts from a different premise: an agent interaction — one user turn, one background job, one multi-step tool-using run — is the thing worth understanding as a whole, not as a bag of disconnected spans. A single agent call might touch a retriever, three LLM calls, two tool invocations, and a retry, and Tracify groups all of it into one trace with session context preserved across turns.
Because the platform knows what a "prompt," a "completion," a "tool call," and a "retry" are, it can do things a generic telemetry store cannot without custom work: compute cost per call from the actual token counts and provider pricing, run an evaluation against a saved test case, and flag when a retry rate or hallucination score drifts between deployments. None of that requires the team to build a custom dashboard first — it is the default view.
The same design choice extends to multi-agent systems. When a research agent hands off to a drafting agent, which hands off to a review agent, Tracify keeps the parent-child relationship intact as one session, so a reviewer can open a single trace and see the whole chain of reasoning — not three unrelated service logs that happen to share a request ID someone remembered to propagate.
Field note: The fastest way to tell which platform you actually need is to ask what question you want answered first thing tomorrow morning. "Which service is degrading" is an OpenObserve question. "Which prompt version is costing us more per resolved ticket" is a Tracify question.
Scenario 1: the legacy platform with mixed observability needs
A mid-size logistics company runs 40 backend services — order management, routing, billing, notifications — plus one recently added LLM-based support agent that drafts responses to shipment disputes. The platform team owns uptime for everything. The support-agent team owns response quality and cost for one feature.
With OpenObserve: The platform team self-hosts OpenObserve on three nodes backed by S3-compatible storage. Logs, metrics, and traces from all 40 services land in one system, queried with SQL and PromQL, with dashboards the team already knows how to build because they mirror what they had running against Prometheus and Loki before. The support agent's OpenTelemetry spans land in the same pipeline — the platform team can see that the agent service is up, its P95 latency, and its error rate, exactly like every other service.
What OpenObserve cannot tell the support-agent team is why the agent drafted a wrong refund amount on Tuesday, whether the new prompt template is more expensive per resolved ticket than the old one, or whether last week's model swap regressed quality on the test set of past disputes. Those questions need a second, custom-built layer on top of the generic spans — extracting token counts from span attributes, joining them against a hand-maintained pricing table, and writing bespoke evaluation scripts that run outside the platform.
Worked cost, illustrative: At roughly 1.5 million total infrastructure events per day across the 40 services plus the agent, a self-hosted OpenObserve cluster sized for that ingest runs approximately $350–500/month in compute and object storage, plus an estimated 8–10 hours/month of operator time (upgrades, index tuning, capacity planning) at a blended $75/hour — call it $600–750/month fully loaded. That single spend covers all 40 services and the agent's infrastructure health.
With Tracify added for the agent only: The platform keeps OpenObserve exactly as it is for the 40 services. The support-agent team adds Tracify's SDK to the one agent service. At the agent's actual volume — roughly 45,000 support interactions/month — Tracify's managed cost lands around $300–450/month, and in exchange the team gets per-call cost breakdown, a regression-detecting evaluation suite running against the historical dispute test set, and session-level views of multi-turn disputes without writing a line of custom analysis code.
Result: This is not a competition. The platform team's problem (uptime and correlation across 40 heterogeneous services) and the product team's problem (why did this agent decide this, and what did it cost) are different enough that running both tools, each scoped to what it is good at, costs less in total engineering time than trying to force one platform to do both jobs.
What the platform team would have given up by picking only one
If the platform team had insisted on OpenObserve alone for the agent too, the support-agent team would have spent its first quarter building a scoring script against a set of past disputes, a token-to-dollar conversion job that needed updating every time a provider changed pricing, and a way to notice when the drafting quality regressed — all before shipping the first prompt improvement. If the support-agent team had instead insisted on Tracify alone for everything, the platform team would have lost the unified correlation view across 40 services that made their last three incident postmortems fast, and would have needed a second system anyway for host metrics and non-agent logs Tracify has no model for. Scoping each tool to its strength avoided both of those losses.
Scenario 2: the multi-agent system with quality gates
A legal-tech startup ships a three-agent pipeline: a research agent that retrieves case law, a drafting agent that writes a memo, and a review agent that checks the memo against a rubric before a human sees it. The product only exists because of the agents — there is no meaningful "infrastructure" beyond the pipeline itself and a thin API layer.
With OpenObserve alone: Every agent call is instrumented as OpenTelemetry spans, and OpenObserve ingests them without complaint — its trace search works fine for finding a specific run by ID or filtering by status. But the team's actual job is release-gating: before shipping a new retrieval prompt, they need to know whether the review agent's rejection rate went up, whether the average cost per memo moved, and whether specific classes of case law queries got worse. Building that requires the team to define what a "trace" even means across three separate agent services (OpenObserve has no native concept of a multi-agent session), extract cost from raw token attributes, and write and maintain their own scoring harness against a set of reference memos — essentially building the first version of an evaluation product before they can trust a single deploy.
With Tracify: Each of the three agents reports into one session-aware trace. Cost per memo is visible per model and per agent step without custom aggregation. The team defines test cases once — a set of representative fact patterns with expected memo outcomes — and Tracify runs them against every candidate prompt version, surfacing a regression the moment the review agent's pass rate drops. None of the three agents needs a hand-built pricing table or a bespoke scoring script.
Worked cost, illustrative: At 12,000 memos/month, each involving roughly 6–9 LLM calls and 2–3 tool calls across the three agents, an estimated Tracify subscription runs $500–750/month. Reproducing the evaluation and cost-tracking layer on top of self-hosted OpenObserve — even assuming the $150–250/month infra cost for a cluster at this modest volume — would require an estimated 25–40 hours of one-time engineering to build the scoring harness and pricing joins, plus 4–6 hours/month to maintain them as prompts and providers change. At a blended $100/hour for a founding engineer's time, that upfront build alone costs more than a year of the Tracify subscription.
Result: When the product is the agent pipeline, and the hardest question is quality and cost rather than uptime, a platform that already understands prompts, tool calls, and evaluation earns back its subscription in avoided build time, not just avoided infrastructure spend.
What building the evaluation harness actually involves
It is worth naming the specific work behind the "25–40 hours one-time" estimate, because it is easy to underestimate from the outside. A team building evaluation on top of raw OpenObserve spans needs: a stable set of reference fact patterns with agreed-upon expected outcomes (usually harder to agree on than it sounds, since legal memos rarely have one correct answer); a scoring method that can compare a generated memo against a rubric without a human in the loop for every run; a runner that replays the fixed inputs through the current prompt version and stores results somewhere queryable; and a comparison view that flags when a new version's pass rate drops relative to the last known-good version. Each of those four pieces is a small project on its own, and the second and third tend to need rework every time the team changes models or adds a new agent to the pipeline.

Feature-by-feature comparison
Tracing and instrumentation
OpenObserve ingests OpenTelemetry traces natively and stores every span with full attribute fidelity. It has no opinion about what a span represents — a database query, an HTTP call, and an LLM completion are all just spans with tags, which means instrumenting an agent is exactly as much work as instrumenting any other service: you decide what attributes to attach (model name, token counts, prompt hash) and build the query and dashboard layer yourself.
Tracify ships SDKs that understand agent shapes out of the box — a decorator around an LLM call automatically captures prompt, completion, model, latency, and token usage; nested tool calls and retries are grouped under the parent trace without manual span-linking; and multi-turn sessions carry context forward automatically. The instrumentation work is smaller because the SDK already knows what an agent interaction looks like.
Both platforms speak OpenTelemetry, so a team already emitting OTel spans is not locked out of either — the difference shows up after ingestion, in how much manual work turns raw spans into an answer.
Evaluation and quality gates
OpenObserve has no built-in concept of a test case, an expected output, or a regression score. Teams that want evaluation build it themselves — usually a script that replays a fixed set of inputs, calls the agent, and compares outputs against a rubric or reference answer, with results stored somewhere OpenObserve can query as just more log lines.
Tracify treats evaluation as a first-class object: define a test case once, attach a scoring method (exact match, rubric, model-graded, or custom function), and run it against any prompt or model version. Regressions between versions surface automatically rather than requiring someone to remember to run the comparison.
Cost tracking
OpenObserve can store cost-relevant attributes (token counts, model names) as span fields if you attach them, but there is no built-in pricing table, no per-provider rate tracking, and no dashboard that turns "tokens used" into "dollars spent by model this week" without a custom transformation layer that someone has to keep current as providers change their prices.
Tracify tracks cost per call natively: it knows current provider pricing across major LLM vendors, attributes cost to the specific model and route used, and rolls that up into per-agent, per-session, and per-time-period views without extra configuration.
Infrastructure monitoring
OpenObserve is genuinely strong here — it is a real alternative to running Prometheus, Loki, Jaeger, and Grafana as four separate systems, unifying them into one binary with one query surface and one storage layer. Alerting, dashboards, and correlation across logs/metrics/traces for infrastructure and application services are core, mature functionality, not an afterthought.
Tracify does not attempt this. It has no concept of host metrics, database connection pools, or Kubernetes pod health, and pairing it with an infrastructure tool (OpenObserve or otherwise) is the expected pattern for teams that need both.
Self-hosting and data control
OpenObserve can run entirely inside your infrastructure with no data leaving your network — a meaningful advantage for teams with data-residency requirements, air-gapped environments, or a strong preference against sending telemetry to a third party. The operational cost of that control is real: someone owns upgrades, scaling, backups, and on-call for the observability system itself.
Tracify is managed SaaS only. There is no self-hosted or on-prem option today. Teams accept that trade for less operational surface area to own, at the cost of data leaving their infrastructure and no control over the underlying deployment.
Extensibility and query surface
OpenObserve exposes SQL and PromQL directly, which means anything expressible in those languages — arbitrary joins, custom aggregations, ad hoc exploration — is available without waiting on a vendor feature request. That flexibility is a genuine advantage for teams with unusual query needs or existing SQL-heavy tooling.
Tracify's query surface is scoped to agent-shaped questions — trace search, cost breakdowns, evaluation results — which is faster to a useful answer for those specific questions but does not offer the same open-ended query flexibility for questions the product wasn't designed around.

A quick illustrative query comparison
The gap between "generic spans" and "agent-aware traces" is easiest to see in how you'd answer one concrete question: what did each model cost us last week, broken down by agent step?
-- Illustrative: OpenObserve SQL over raw OpenTelemetry spans.
-- Assumes token counts and a hand-maintained price-per-token table
-- were already attached as span attributes by your instrumentation.
SELECT
  attributes['agent.step']  AS step,
  attributes['llm.model']   AS model,
  SUM(attributes['llm.prompt_tokens']  * price_table.prompt_rate
    + attributes['llm.completion_tokens'] * price_table.completion_rate) AS est_cost_usd
FROM otel_spans
JOIN price_table ON price_table.model = attributes['llm.model']
WHERE _timestamp >= now() - interval '7 days'
GROUP BY step, model
ORDER BY est_cost_usd DESC;
// Illustrative: the same question against Tracify's SDK-captured
// cost data, where per-call pricing is already resolved server-side.
const costByStep = await tracify.costs.breakdown({
  projectId: "legal-tech-pipeline",
  groupBy: ["agentStep", "model"],
  range: { days: 7 },
});
// Returns resolved USD cost per step/model with no price table to maintain.
Both queries answer the same question. The OpenObserve version requires that someone built and is maintaining the price table and the attribute-tagging convention; the Tracify version assumes the platform already resolved pricing at ingest.
Twelve-month total cost of ownership
TCO for either platform is not just the subscription or infrastructure line — it includes the engineering time spent building what the platform doesn't provide out of the box.
| Cost component | Self-hosted OpenObserve (LLM/agent workload only) | Tracify (managed) |
|---|---|---|
| Infrastructure (compute + storage) | ~$150–900/month depending on volume | Included in subscription |
| Operator time (upgrades, scaling, on-call) | ~5–18 hours/month at $75/hr blended | None — managed |
| Initial evaluation harness build | ~25–40 hours one-time | None — built in |
| Cost-tracking / pricing-table build | ~10–20 hours one-time, plus ongoing upkeep as prices change | None — built in |
| Subscription | $0 (self-hosted) | ~$450–4,500/month depending on volume |
| Illustrative 12-month total, mid volume (~1M traces/mo) | ~$16,000–22,000 (infra + ops + one-time build, no subscription) | ~$16,800–20,000 (subscription only) |
At low agent volume, Tracify's managed convenience tends to cost less than the one-time build investment for a self-hosted evaluation and cost-tracking layer. At high volume with an existing platform team already running OpenObserve for infrastructure, the marginal cost of extending it to cover more agent traffic can undercut Tracify's usage-based pricing — provided the team is willing to own and maintain the custom evaluation and cost logic indefinitely, not just build it once.
Decision rule: If nobody on the team currently owns "maintain the evaluation harness" as an explicit, staffed responsibility, assume the self-hosted build cost recurs every time a model or pricing structure changes — because in practice, it does.
When OpenObserve genuinely wins
It is worth being direct about where OpenObserve is simply the better choice, not just the cheaper one:
You need one platform for logs, metrics, and traces across many non-agent services. If agents are a small fraction of what you run, a platform built for infrastructure breadth serves the other 90% of your systems better than a platform that has no concept of a database connection pool.
Data residency or air-gapped deployment is a hard requirement. If your telemetry cannot leave your network for regulatory or contractual reasons, self-hosting is not optional, and OpenObserve is a mature option for that constraint.
You already run it, and it works. Migration cost is real. A platform team with years of dashboards, alerts, and institutional knowledge built on OpenObserve should weigh that sunk investment honestly against the incremental value of agent-specific features for what is often a small slice of total traffic.
Your query needs are genuinely open-ended. SQL and PromQL give you unrestricted exploration. If your team routinely asks questions no dashboard anticipated, that flexibility has real value a narrower product surface doesn't match.
Storage cost at high retention is a first-order concern. Columnar storage on object storage is objectively cheap per gigabyte at long retention windows, which matters for compliance-driven retention requirements measured in years, not weeks.
Migration paths
From OpenObserve to Tracify
Teams moving their agent workload off a self-hosted OpenObserve setup typically keep OpenObserve running for infrastructure and layer Tracify in for the agent services specifically, rather than a full cutover. The practical steps: instrument the agent service(s) with Tracify's SDK alongside existing OpenTelemetry instrumentation (the two are not mutually exclusive), run both in parallel for a release cycle to validate that Tracify's cost and trace data matches expectations, then retire any custom evaluation or cost-tracking scripts that were built on top of the OpenObserve data once the team trusts the native equivalents.
From Tracify to a self-hosted OpenObserve setup
This path is less common but happens when data residency requirements change, or when the agent workload has grown into a broader platform where unifying with existing infrastructure monitoring outweighs the convenience of a managed product. The practical steps: stand up OpenObserve and validate OpenTelemetry ingestion against a non-production agent instance first, rebuild the specific evaluation test cases and scoring logic that Tracify provided natively (this is the largest single piece of migration work), and rebuild cost attribution using a maintained pricing table before cutting production traffic over. Budget the evaluation-harness rebuild as the long pole, not the data migration itself.
Running both, on purpose
The most common stable end state for teams with real infrastructure breadth and real agent depth is not a migration at all — it's OpenObserve for infrastructure and Tracify for agents, each doing the job it was built for, connected only by shared service names and timestamps for manual correlation when an incident touches both.
Make the operating decision
| Your situation | Lean toward |
|---|---|
| Many non-agent services, agents are a minor slice of traffic | OpenObserve |
| Agent-only or agent-first product, quality and cost are the hard problems | Tracify |
| Data residency or air-gapped deployment is required | OpenObserve |
| No dedicated platform team to own a self-hosted system | Tracify |
| Existing OpenObserve investment with mature dashboards and alerts | Keep OpenObserve; add Tracify for agents only |
| Both infrastructure breadth and agent depth genuinely matter | Run both, scoped to what each does well |
Leave the reader with the next move
- [ ] You've named whether your hardest observability problem is infrastructure breadth, agent-specific depth, or both.
- [ ] You've estimated your monthly agent trace volume and mapped it to the worked cost ranges above.
- [ ] You've checked whether evaluation and cost tracking are staffed as an ongoing responsibility if you plan to self-host and build them.
- [ ] You've confirmed whether data residency or air-gapped deployment rules out a managed SaaS option outright.
- [ ] You've decided whether running both platforms, each scoped narrowly, costs less in total engineering time than forcing one to do both jobs.
If your agents are the product and quality regressions or runaway cost are the risk you lose sleep over, read the AI agent observability complete guide for the full picture beyond tracing, then see how to reduce LLM costs without hurting quality for where cost optimization compounds once you can see it clearly.
Frequently asked questions
Can I run OpenObserve and Tracify together?
Yes, and for teams with both real infrastructure breadth and real agent-specific needs, this is the most common stable setup: OpenObserve covers logs, metrics, and general traces across all services, while Tracify covers agent-specific traces, cost, and evaluation for the LLM workload specifically.
Does OpenObserve support LLM or agent tracing at all?
It ingests OpenTelemetry spans from any source, including LLM calls, so basic trace storage and search work. It has no built-in concept of prompts, tool calls, evaluation, or provider cost, so those require custom instrumentation and dashboards on top of the generic span data.
Is self-hosting OpenObserve actually cheaper than Tracify?
It depends on volume and what you're comparing. Infrastructure cost alone is often lower at scale, but total cost of ownership includes operator time and, if you want evaluation or cost tracking, the engineering time to build and maintain that layer yourself — which frequently outweighs the infrastructure savings at low-to-moderate agent volume.
Why doesn't Tracify do infrastructure monitoring?
It's a deliberate scope choice, not a missing feature waiting to ship. Building agent-specific depth well — evaluation, cost attribution, session context — is a different product than building infrastructure breadth well, and trying to do both usually means doing neither at the level a dedicated tool can.
What's the biggest hidden cost when self-hosting OpenObserve for LLM observability?
Not the infrastructure bill — the ongoing engineering time to build and keep current an evaluation harness and a provider pricing table, both of which need maintenance every time a model changes, a provider adjusts pricing, or a new agent ships.
Practical field notes from the team building Tracify and operating AI agents in production.
Related posts

Next in the loop
Parea AI vs Tracify: LLM Development vs Agent Observability
Keep reading →