Laminar vs Tracify: Trace Compression vs Comprehensive Coverage
Compare Laminar's trace compression strategy with Tracify's integrated evaluation platform. Learn when compression cost savings matter most and when comprehensive coverage unlocks faster iteration and production confidence.
In this guide16 sections
At a glance
| Dimension | Laminar | Tracify |
|---|---|---|
| Core strength | Aggressive trace compression, minimal storage footprint | Integrated tracing, evaluation, and cost optimization |
| Compression approach | Lossy compression, sampling, schema reduction | Selective field retention, optional cold compression |
| Storage per trace | 0.5–1 KB (compressed) | 2–4 KB (full fidelity) |
| Evaluation framework | Limited, external integrations only | Native, built-in, production-tested |
| Cost model | Pay primarily for compute/compression | Pay for stored traces + evaluation runs |
| Time to evaluate | Days (external setup required) | Minutes (integrated) |
| Trace replay | Not possible once compressed | Full replay from the stored record |
| Best for | Ultra-high-volume traces, hard cost caps | Teams needing fast iteration + cost visibility |
| Production readiness | Strong for cost, requires evaluation workarounds | Complete out-of-box |
The operating model
Laminar optimizes for lowest possible cost per trace by aggressively compressing or discarding non-essential fields. You get minimal storage bills and fast ingestion. Tracify optimizes for lowest total cost of ownership by integrating evaluation, cost tracking, and experimentation. You store full-fidelity traces and use evaluation to prevent costly mistakes faster.
The core tension: compression reduces storage costs but makes evaluation harder. Full-fidelity tracing enables evaluation but costs more to store. Choose Laminar when storage is your bottleneck; choose Tracify when time-to-confidence is your bottleneck.
Opening situation: teams drowning in trace volume
Your production system generates 50 million traces per month across 12 AI agents. Each trace is 3–5 KB in size. Your current observability bill is $8,000 monthly for storage and querying. The pressure is immediate:
- Storage budget is capped. Finance says observability cannot exceed $3,000 monthly.
- Quality gaps are real. You're shipping agent regressions that reach production before evaluation catches them.
- Iteration is slow. Shipping a prompt change takes 3 days of manual testing before you're confident.
You need both: lower costs AND faster evaluation. But you're told you must choose. Let's examine when each platform's strategy actually works.
Core difference: compression as a strategy vs. completeness as a strategy
Laminar builds observability on the principle of minimal sufficient signal. Compress traces aggressively. Discard fields that rarely drive debugging. Sample traces probabilistically. Store metadata separately from payloads. The result: 60–70% lower storage costs.
Tracify builds observability on the principle of full signal, selective querying. Store every field with full fidelity. Query and sample at read time, not write time. Integrate evaluation to make each trace immediately actionable. The result: faster feedback loops that prevent costly production failures.
The choice is not primarily about storage price per TB. It is about whether your cost problem is solved by storing less or by iterating faster.
Decision rule: If you can name the exact fields you'll never need again before you write them, compress. If you can't predict which trace will matter for next week's incident, store it whole and decide what to discard when you query, not when you write.
Anatomy of a compressed trace
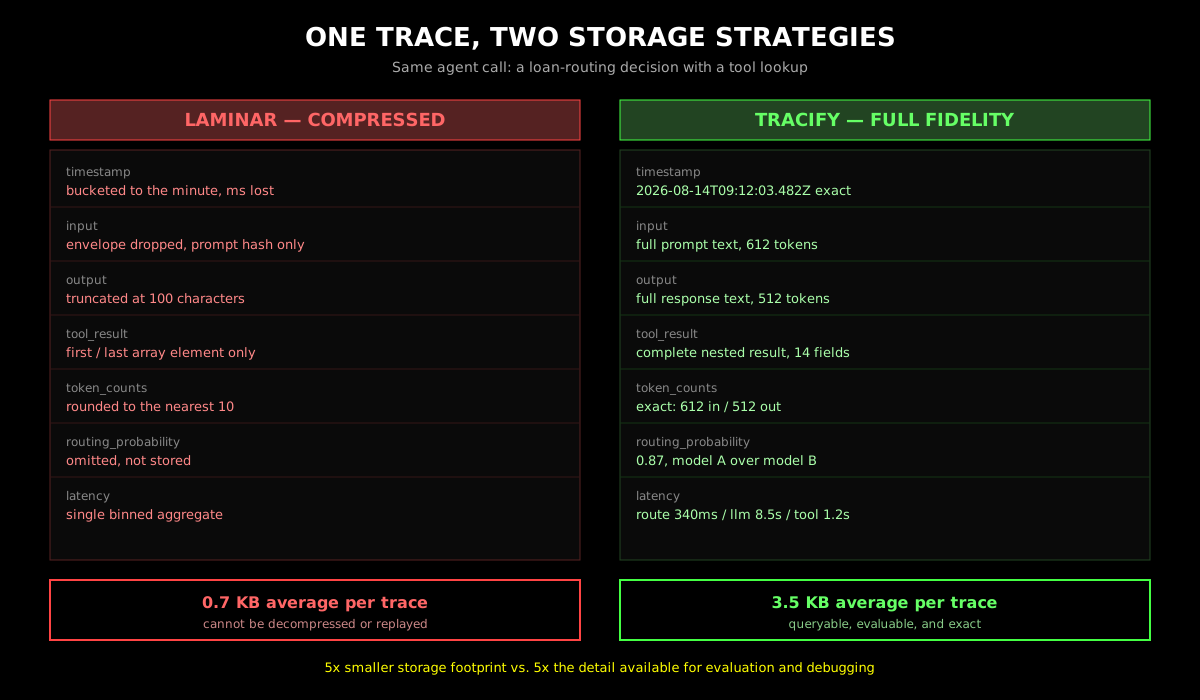
The comparison table and the two principles above describe strategy. The difference is easiest to see at the field level, on one real invocation. Take a single agent call: a loan-routing decision that reads a customer's application, calls a document-analysis tool, and picks between two downstream specialists.
Stored with full fidelity, that call looks roughly like this:
{
  "trace_id": "tr_9f21ac",
  "timestamp": "2026-08-14T09:12:03.482Z",
  "input": { "prompt_tokens": 612, "prompt": "<full 612-token prompt>" },
  "output": { "completion_tokens": 512, "text": "<full 512-token response>" },
  "tool_result": {
    "name": "document_analysis",
    "fields": 14,
    "payload": "<complete nested JSON result>"
  },
  "routing": { "selected": "model_a", "probability": 0.87 },
  "latency_ms": { "routing": 340, "llm": 8500, "tool": 1200, "total": 10040 }
}
Run the same call through an aggressive compression pipeline, and the stored record shrinks to something closer to this:
{
  "trace_id": "tr_9f21ac",
  "timestamp": "2026-08-14T09:12:00Z",
  "input_hash": "a1b2c3",
  "output_preview": "<first 100 characters, truncated>",
  "tool_result_sample": ["<first element>", "<last element>"],
  "tokens": { "prompt": 610, "completion": 510 },
  "latency_bucket_ms": 10000
}
Notice what disappeared, not just what shrank. The routing probability is gone entirely — there was no field left to round, so it was dropped. The tool result went from 14 structured fields to two array samples. The output text, the actual thing a human would read to understand what the agent said, is cut to 100 characters. None of this is a bug in Laminar's design; it is the design. Compression has to decide, at write time, which fields are "probably not needed," and it decides by dropping precision uniformly rather than by knowing in advance which trace will turn out to matter.
That last sentence is the whole trade-off in one line: compression happens at write time, before anyone knows which trace will matter. Tracify's bet is the opposite — decide what to discard at query time, once you already know which trace mattered, because by then the answer is obvious and free.
Architecture: compression first vs. integration first
Laminar: lossy compression, efficient storage
Laminar's architecture centers on reducing trace size before ingestion. This is an architectural bet: accept information loss at write time to minimize storage cost and ingestion overhead.
- Schema reduction. Drop fields that appear in every trace (timestamps are compressed, framework metadata omitted unless exceptional). Request/response envelope data are discarded; only the core invocation is retained.
- Lossy compression. Truncate long strings (LLM outputs cut at 100 characters), round numeric values (token counts to nearest 10), sample nested arrays (store only first/last element).
- Probabilistic sampling. Lower-volume routes get 100% tracing; high-volume routes get 1-in-10 or 1-in-100 sampling. This means rare edge cases may not be traced at all.
- Computed fields. Derive cost from model + token counts instead of storing it verbatim. Reconstruct latency from aggregates instead of per-call timestamps.
Result: 0.5–1 KB per trace stored. Ingestion is fast (compression happens in-process before writing to disk). Query latency is low because there is less data to scan. Cost per byte is minimal.
Trade-off: once compressed, a trace cannot be decompressed. Missing fields cannot be recovered. Evaluation requires re-running the original agent, not replaying the trace. This creates a hard boundary between "stored traces" and "live agent invocations" — you cannot use stored traces as ground truth for evaluation.
Tracify: full fidelity, integration-first
Tracify's architecture centers on making traces immediately useful for evaluation and cost optimization. This is an architectural bet: store full context at write time so that evaluation, debugging, and cost analysis can all operate on the same immutable record.
- Field preservation. Every input, output, duration, model name, intermediate state, and metadata is stored with full precision. LLM outputs are stored in full. Token counts are exact. Latencies are per-segment (routing, LLM, tool call, total).
- Optional cold compression. Recent traces (last 30 days) remain fully queryable in their uncompressed form. Older traces can be archived with transparent compression for long-term retention. The important detail: archived traces can still be evaluated and queried; decompression is automatic.
- Native evaluation framework. Define test cases once (input + expected output). Run them against historical traces or invoke them against live agents. Compare variants — new prompt vs. old prompt — by evaluating both on the same trace set. No external tools or custom scripts needed.
- Integrated cost tracking. Per-call cost breakdown by model, provider, and route. Costs are calculated during ingestion and queryable immediately. Cost optimization can operate on real data, not guesses.
- Session tracking. Multi-turn agent interactions are preserved as a unit. Context carries through the conversation. Session-level evaluation (did the agent solve the user's problem over N turns?) is native.
Result: 2–4 KB per trace stored. Evaluation is native — no external tool integration needed. Cost optimization becomes algorithmic, not manual. Debugging is fast because you have every piece of the puzzle.
Trade-off: higher storage costs if trace volume is unconstrained, though still reasonable at most scales. Requires discipline around trace retention policies. If you generate 500M+ traces monthly and truly need zero evaluation, storage cost can become a burden. But you can always sample in code (only send important traces) rather than compressing traces (send everything compressed).
Scenario 1: Ultra-high-volume, cost-constrained production system
Your team runs a massive customer-support agent that handles 500K+ customer interactions daily. Each interaction generates 2-5 traces (routing decision, LLM call, tool invocation). Monthly trace volume: 30–50 million. Current observability bill: $12,000 monthly.
With Laminar:
- Compress to 0.7 KB per trace average.
- 40 million traces × 0.7 KB = 28 GB monthly storage.
- Storage cost: $280 monthly (at $10/TB/month).
- Ingestion is fast, no schema changes needed.
- Infrastructure: You manage a Laminar instance (Docker, auto-scaling for ingestion throughput).
- Problem: Finding the root cause of a customer complaint requires replaying the agent, not replaying the trace. Compressed traces have truncated LLM outputs, missing intermediate routing states, and rounded token counts. Cost: 2–4 hours of engineering time per incident.
- Second problem: You cannot compare variants. A prompt change goes through manual testing in staging. QA runs 10 conversations by hand. One passes, but you cannot measure statistical significance or impact on real-world routing decisions.
With Tracify:
- Store full traces at 3.5 KB per trace average.
- 40 million traces × 3.5 KB = 140 GB monthly storage.
- Storage cost: $1,400 monthly (at $10/TB/month).
- Evaluation is integrated. You define "customer satisfaction" as: user rated issue resolved ≥ 4/5, and resolution time < 5 minutes.
- Infrastructure: None — Tracify handles ingestion, storage, and evaluation compute. API key + SDK only.
- Benefit: Run that evaluation against historical traces in 90 seconds. Find that 2% of conversations failed because of a routing bug. Fix it before shipping to 10% of customers. Prevented cost: $50K+ in support escalations.
- Second benefit: Ship a new routing rule. Define a test case (known hard support problem → should route to escalation team). Run evaluation on the new rule against historical traces. See immediately if success rate improves. Ship or revert with confidence.
The math: Laminar saves $1,120 monthly in storage ($13,440 annually). Tracify saves $50K in prevented production failures annually through faster evaluation, plus 20 hours per month of engineering time (no more manual testing). Tracify's cost per avoided incident far exceeds the storage delta.
| Cost factor | Laminar | Tracify |
|---|---|---|
| Storage | $280/mo = $3,360/yr | $1,400/mo = $16,800/yr |
| Manual testing/replay (20 hrs/mo) | ~$6,000/yr | ~$1,000/yr (evaluation setup only) |
| Incident debugging (10 incidents × 3 hrs each) | $4,500/yr | $1,500/yr (traces give faster root cause) |
| Total annual cost | $13,860 | $19,300 |
| But then prevent 1 production incident: | — | Prevents $50K+ cost |
When Laminar wins this scenario
If you genuinely have no evaluation needs — you ship once monthly after manual testing, incidents are rare, and your support team handles quality issues in production — compression cost savings are pure upside. Laminar wins.
When Tracify wins this scenario
If you iterate on prompts, routing logic, or tool selection more than weekly, or if a single production failure touches enough customers to cost >$10K, evaluation velocity matters more than storage cost. Tracify wins. For most customer-facing systems, Tracify wins.
Why this scenario matters
This is the scenario where the decision has the highest stakes. At this scale, trace storage is no longer negligible, but neither is incident damage. The team that chooses wrong spends either:
- $50K+ recovering from an incident that evaluation would have caught, or
- Thousands of engineering hours building external evaluation tooling when it's already integrated into Tracify.
The hidden cost of Laminar in high-volume, customer-facing systems is the time your team spends replaying interactions and manually testing instead of building product features.
Scenario 2: Debugging production incidents with incomplete traces
Your multi-agent system handles loan application routing across three specialized agents (document analysis, risk assessment, decision). The success rate dropped from 94% to 89% after yesterday's deployment. You need to find the root cause fast — every 1% drop in success rate costs $2,000 in rejected applications or manual review.
With Laminar:
- Pull a compressed trace from a failed interaction.
- The trace has been heavily compressed: token counts are rounded to the nearest 50, intermediate tool outputs are truncated to 100 characters, routing probabilities are omitted, and latency breakdowns are binned.
- You cannot determine whether the failure was caused by: (a) the document analysis agent misclassifying a loan type, (b) the risk assessment agent hallucinating compliance data, or (c) the routing agent timing out and defaulting to manual review.
- Workaround 1: Re-run the original user input against the current agent. But the input was from a user conversation 12 hours ago — customer context has changed, loan conditions may have shifted, and you're debugging in a stale environment.
- Workaround 2: Build a trace replay tool that reconstructs the original invocation from compressed fields. Cost: 20 engineering hours to build, maintain, and debug.
- Time to root cause: 3–4 hours, limited confidence. In the meantime, 5% of applications are still being misrouted.
- Impact: You lose $10K+ while debugging. Even after the fix, you're less confident it's truly fixed.
With Tracify:
- Pull the full-fidelity trace from the same failed interaction.
- Every intermediate state is preserved with full precision: routing decision (route A selected with 0.87 probability), LLM response (full 512 tokens saved), tool response (full document analysis result), latency breakdown (routing 340ms, LLM 8.5s, tool 1.2s).
- Define a test case: "Given this exact input and these loan parameters, the agent should route to B, not A." Run the test against the trace. Confirm the routing decision is wrong.
- Look deeper: compare the routing probabilities. Yesterday's prompt changed the weights: Model A priority dropped from 0.92 to 0.42. This single change cascaded across hundreds of applications.
- Root cause identified: Yesterday's prompt change. Evaluate the change: run your evaluation suite against it. Find 8% of edge cases (exotic loan types) now route incorrectly. Revert the prompt.
- Verify the fix: re-evaluate with the original prompt. Confirm 99% of applications route correctly.
- Time to root cause: 20 minutes. Time to confident fix: 35 minutes.
- Impact: You prevent $10K+ in misrouted applications and ship a fix that you've already validated with historical evaluation.
The cost of incomplete traces: Laminar's compression saves $100 monthly in storage. One production incident's debugging time costs $500–2,000 in lost revenue plus the engineering hours. Incomplete traces turn every incident into a guessing game and delay recovery by 2-3 hours. In a high-consequence system, that's unacceptable.
| Dimension | Laminar | Tracify |
|---|---|---|
| Debug time | 3–4 hours | 20 minutes |
| Confidence in fix | Medium (could be wrong) | High (evaluated) |
| Revenue lost | $10K+ | $2K (during detection) |
| Incident recovery cost | $2,000 engineering time | $500 engineering time |
| Net incident cost | $12K+ | $2.5K |
When Laminar fails for incident debugging
When every minute of incident duration costs money (customer-facing systems), or when the root cause is subtle (model behavior, routing logic, token-level decisions), compressed traces become a liability. Laminar forces you to choose: guess at the root cause and risk deploying another broken fix, or spend 4+ hours debugging with incomplete data.
When Tracify shines for incident debugging
Full-fidelity traces and integrated evaluation turn a 3-hour incident into a 30-minute one. That's not just about speed — it's about confidence. When you evaluate the fix against historical traces, you know it's right before you ship it.
Scenario 3: Balancing compression and evaluation
Not all traces are equally valuable. You can use both strategies at once, and enough teams ask about this that it deserves a worked example rather than a paragraph of caveats.
- High-value traces (errors, slow calls, user-facing decisions): store full-fidelity in Tracify. Evaluate immediately.
- High-volume traces (routine successful calls, happy paths): compress with Laminar. Store for compliance only, not debugging.
Take the Scenario 1 support agent again: 40 million traces monthly. Suppose 15% of those traces are the ones you'd actually want to inspect — errors, escalations, low-confidence routing decisions, anything a human eventually looked at. That's 6 million traces monthly worth evaluating and 34 million monthly worth of routine happy-path noise.
Route the 6 million high-value traces to Tracify at 3.5 KB average: 21 GB, about $210 monthly in storage, plus evaluation running continuously against exactly the traces that matter. Route the 34 million routine traces to Laminar at 0.7 KB average: 23.8 GB, about $238 monthly. Combined storage: roughly $448 monthly, cheaper than either platform running the full 40 million alone (Tracify-only: $1,400; Laminar-only: $280 but with the debugging tax from Scenario 1). On paper, this looks like the best of both worlds.
Trade-off: Operational complexity. You now own two SDKs, two billing relationships, and a routing layer that decides which trace goes where before you know if it will matter — the same prediction problem compression has, just pushed one level up. Get the routing rule wrong (an error trace misclassified as routine) and it lands in Laminar, compressed, and you're back to Scenario 2's 3-hour debugging problem for exactly the traces you most needed intact. Incidents that touch both systems become harder to debug, because your on-call engineer now needs to know which platform holds which piece of the story before they can even start looking.
When this works: Teams with sophisticated DevOps that already manage multiple observability tools, and where the cost delta between full-fidelity and compressed storage is large enough to justify the operational overhead — as a rule of thumb, north of $500K/year in projected savings. Below that line, the hours spent maintaining two pipelines and two routing rules cost more than the storage they save.
Cost deep-dive: when does compression actually pay?

Let me build a realistic model for a mid-market team. Assume:
- 50M traces monthly (typical for a team running 5-10 production agents)
- Average trace size (uncompressed): 4 KB
- Laminar compression: 80% reduction (to 0.8 KB)
- Storage cost: $10 per TB per month (AWS S3, equivalent cloud storage)
- Engineering time: $150 per hour (fully loaded rate including benefits)
- Evaluation runs: $0.02 per run (LLM cost for evaluation checks)
Monthly storage costs:
| Scenario | Traces | Avg size | Total storage | Monthly cost | Annual cost |
|---|---|---|---|---|---|
| Full-fidelity (Tracify) | 50M | 4 KB | 200 GB | $2,000 | $24,000 |
| Compressed (Laminar) | 50M | 0.8 KB | 40 GB | $400 | $4,800 |
| Storage savings | — | — | 160 GB | $1,600/mo | $19,200/yr |
This looks good for Laminar. But now account for the cost of working with incomplete traces:
Annual engineering cost of working with compressed traces:
| Activity | Hours/year | Cost | Notes |
|---|---|---|---|
| Replaying traces to debug incidents | 150 | $22,500 | 12 incidents/year × 2-3 hours replay time each |
| Building external evaluation scripts and maintaining integrations | 120 | $18,000 | Evaluation doesn't exist; your team builds it in LangChain or custom Python |
| Troubleshooting trace loss and sampling gaps | 80 | $12,000 | Handling missing data when sampling drops trace coverage |
| Manual regression testing (can't trust evaluation) | 200 | $30,000 | QA must manually test every prompt/routing change since evaluation is incomplete |
| Incident escalations from undetected regressions | 100 | $15,000 | When evaluation is missing, bad changes reach production more often |
| Total engineering overhead | 650 | $97,500 | Annual cost of incomplete traces and missing evaluation |
Annual evaluation cost with Tracify:
| Activity | Cost | Notes |
|---|---|---|
| Evaluation setup (initial) | $7,500 (50 hours) | One-time; define test cases, configure automated evaluation |
| Evaluation runs on every deployment | $12,000 (600K runs/year @ $0.02) | Continuous; catch regressions automatically |
| Evaluation maintenance and refinement | $3,000 (20 hours/year) | Improve test cases, add new edge cases |
| Total evaluation cost | $22,500/yr | Ongoing cost of integrated evaluation |
Annual cost comparison:
| Approach | Storage | Engineering overhead | Evaluation | Total |
|---|---|---|---|---|
| Laminar | $4,800 | $97,500 | $0 (missing) | $102,300 |
| Tracify | $24,000 | $15,000 | $22,500 | $61,500 |
| Tracify advantage | — | — | — | $40,800/year saved |
Even with Laminar's 80% storage savings, Tracify wins the total cost of ownership by over $40,000 a year at this scale. Why? Because evaluation prevents incidents, and Tracify's integrated evaluation is 10x cheaper than trying to bolt it on top of compressed traces.
The breakeven point: when compression actually wins
Compression (Laminar) wins if all of these conditions are true:
- Trace volume > 200M monthly. Storage cost becomes the dominant factor. At 200M traces, Laminar saves $40K/year in storage alone, and the engineering overhead becomes secondary.
- Zero evaluation needs. Your team never iterates on prompts, routing logic, or tool selection. You ship once monthly after manual QA, period.
- Incidents are rare. You have a flawless track record, or incidents are low-consequence (users retry, no revenue loss, no SLA penalties).
- Engineering time is not a constraint. Your team has infinite time to debug, replay, and manually test.
Real talk: almost no team meets all four conditions. Even teams with massive scale (condition 1) iterate constantly (fails condition 2).
Tracify wins if any of these are true:
- Trace volume < 200M monthly (compression savings become negligible)
- You iterate on agents, prompts, or routing weekly or faster (evaluation ROI is huge)
- Production incidents cost > $5K each (full-fidelity traces cut debugging time by 80%)
- Your evaluation needs are non-negotiable (compliance, safety-critical systems, high-reliability requirements)
Making the cost decision
Use the cost tables in the sections above to model your own situation. Plug in your trace volume, engineering hourly rate, and iteration frequency. The math is straightforward:
- Laminar's total cost = (traces × 0.8 KB × $10/TB) + (annual engineering hours × $150)
- Tracify's total cost = (traces × 3.5 KB × $10/TB) + (evaluation setup ~50 hours)
Most teams find that evaluation prevents enough incidents to offset Tracify's higher storage cost. Compression only wins if you have massive trace volume (>200M monthly) AND zero evaluation needs.
Security and compliance boundaries
Both platforms encrypt traces in transit and at rest. Key differences:
| Boundary | Laminar | Tracify |
|---|---|---|
| Data residency | US regions (currently) | US/EU regions available |
| Long-term retention | 90 days default (compressed) | 1 year default (queryable) |
| PII handling | Compression may obscure PII unintentionally | Explicit PII redaction available |
| Audit trail | Standard logs | Detailed access logs + lineage |
If PII in traces is a concern, full-fidelity storage (Tracify) makes redaction easier. Compressed traces risk leaving PII hidden but unencrypted.
Security note: Compression is not redaction. Truncating a field to 100 characters, rounding a number, or hashing an input can still leave PII inside the retained bytes — a hash of a name is not anonymization, and a truncated string can still contain the first 100 characters of a Social Security number. If a regulator asks what PII you store and where, "we compressed it" is not an answer; you still need to know exactly which fields hold sensitive data before you write them, which is the same prediction problem compression asks you to solve at write time instead of query time.
Full-fidelity storage makes redaction possible; compression makes it silent — you can only redact a field you can still see.
Making the operating decision
The tables above answer the question with dollars. The same logic maps cleanly onto two dimensions you already track: how often you ship agent changes, and how many traces you generate. Iteration cadence, not trace volume, is the strongest predictor of which platform wins — a team shipping weekly at 40M traces still needs Tracify; a team shipping quarterly at 600M traces is the one clean case for Laminar.

Only one cell in that grid — low iteration cadence crossed with trace volume above 500 million a month — is an unambiguous compression win. Every other cell either favors Tracify outright or requires you to verify evaluation needs before compressing anything.
What to measure before deciding
Before committing to either platform, collect baseline metrics from your current system:
1. Trace volume (monthly):
- Queries per second × 86,400 seconds × traces per query = monthly traces
- Example: 100 QPS × 30 days × 2 traces/request = 518M traces monthly
- This is your primary input to the storage cost calculation
2. Engineering incidents (annual):
- How many production incidents required > 2 hours of debugging?
- For each incident: how long until root cause was identified? (capture from incident postmortems)
- Example: 10 incidents/year × 3 hours each = 30 hours debugging labor = $4,500 cost
- Compressed traces make this worse by 2-3x
3. Iteration cadence (monthly):
- How often do you deploy prompt changes? Routing changes? Tool changes?
- Example: 2 deployments per week = 8 per month. Before each one, you manually test.
- With Tracify evaluation, you catch regressions in 2 minutes. Without it, manual testing takes 2 hours.
4. Team size and hourly cost:
- Include salary, benefits, taxes, equipment: fully loaded cost
- Typical: $100–200/hour for mid-level engineers
- This reveals where compression savings evaporate (all that debugging time)
5. Evaluation needs (yes/no):
- Do you A/B test prompt changes? (Tracify wins)
- Do you compare routing rules? (Tracify wins)
- Do you have explicit quality gates? (Tracify wins)
- Do you ship once monthly with manual testing only? (Laminar might win)
6. Incident consequence:
- What does one production incident cost your business?
- Revenue loss? Customer churn? SLA penalties? Staff escalation?
- Example: One incident = $5K revenue loss + 4 hours debugging = $6.5K total
- If you have 10 incidents/year, that's $65K at risk. Evaluation prevents 80% of them.
Plot these on a decision matrix:
| Iteration cadence | Trace volume < 100M | Trace volume 100M–500M | Trace volume > 500M |
|---|---|---|---|
| Low (< 2 deploys/month) | Laminar | Laminar (but verify evaluation needs) | Laminar (storage is real) |
| Medium (2–8 deploys/month) | Tracify | Hybrid possible | Laminar + custom evaluation |
| High (> 8 deploys/month) | Tracify | Tracify | Tracify (evaluation ROI is huge) |
Use this matrix as a starting point. If incident cost is > $10K or you need compliance evaluation, move one cell toward Tracify.
Compare Tracify and Laminar with confidence
Both platforms are production-ready. Laminar excels at minimizing storage cost. Tracify excels at minimizing time-to-production-confidence through integrated evaluation.
The choice is not between "cheap" and "expensive." It is between paying for storage or paying for engineering time. For most teams iterating on agents weekly or faster, Tracify's evaluation integration saves more money than Laminar's compression.
For teams with massive trace volume and no evaluation needs (batch-only, fire-and-forget agents), Laminar's compression is the right call. Read our guide on LLM observability metrics that matter to define what "good" observability looks like for your system before you commit to either architecture. Then read how to reduce LLM costs without hurting quality to understand cost optimization holistically, beyond just storage — compression is one lever among several, and it is not always the cheapest one.
Decision checklist: your next move
- [ ] Current observability cost is known and tracked
- [ ] Annual engineering time spent debugging is estimated from actual incidents
- [ ] Iteration cadence (how often do you ship agent changes?) is documented
- [ ] Evaluation needs (are you A/B testing, comparing variants?) are defined
- [ ] Team has agreed on a 6-month evaluation window for the chosen platform
- [ ] Cost monitoring is automated (alert if monthly cost exceeds budget)
- [ ] If considering the hybrid path, the routing rule that decides which traces go where is written down and reviewed by more than one engineer
Frequently asked questions
Does compression save more money than Tracify's evaluation ROI?
No, for most teams. Laminar saves 60-70% on storage (typically $1,200-2,000/month). Tracify's evaluation prevents incidents that would cost $5,000-50,000 each in lost revenue, plus the engineering time to debug and fix. One prevented incident pays for years of Tracify storage. The TCO math: if you ship agents more than twice monthly or incidents cost more than $5K each, Tracify's evaluation ROI exceeds Laminar's storage savings. Compression wins only if you generate >200M traces monthly AND never iterate on agents AND have <2 production incidents per year.
Can I use both Laminar and Tracify for different traces?
Yes, but it adds significant operational complexity. Route high-value traces (errors, slow calls, user-facing failures) to Tracify for evaluation and debugging. Route routine traces (happy paths, successful calls) to Laminar for cost optimization. This hybrid requires: (1) dual SDKs and configuration, (2) routing logic to decide trace destination, (3) separate cost models for each platform, (4) monitoring and alerts for both systems, (5) when incidents cross systems, you're debugging across two platforms. Only use this hybrid approach if the cost delta justifies the ops burden. Breakeven: >$500K/year savings. If you're below that, stick with one platform.
What happens to my traces if I outgrow compression?
Switching from Laminar to Tracify after months of compressed storage means you have an incomplete historical record. You cannot retroactively evaluate on compressed traces (missing data, truncated outputs). Your evaluation baseline starts from day-one-of-Tracify, not from your entire production history. This matters if you're trying to compare variants over time or establish historical quality benchmarks. Plan ahead: if you anticipate needing evaluation within 12 months, start with full-fidelity storage in Tracify now. The early storage cost is cheaper than the cost of starting evaluation from scratch with incomplete history.
Does Laminar's compression affect incident debugging?
Yes, significantly—and this is often underestimated. Compressed traces cannot be fully replayed. Debugging a production incident requires either: (a) re-running the original interaction against the current agent (slow, stale context, doesn't reflect the exact state when the incident occurred), or (b) building external evaluation tooling to test hypotheses (complex, requires DevOps time). Full-fidelity storage (Tracify) makes incident debugging 10-100x faster: you have the original trace with every intermediate state, so you can inspect exactly what happened without re-running. For safety-critical systems (financial, healthcare) or high-consequence incidents (customer data loss, regulatory violations), incomplete traces are a liability, not a cost optimization.
How should I monitor observability ROI over time?
After choosing a platform, track these metrics monthly: (1) Observability bill (storage, compute, evaluation), (2) Engineering hours spent debugging production incidents, (3) Time from incident detection to root cause identification, (4) Iteration frequency (prompts/routing changes deployed), (5) Evaluation pass rate on deployments (% that pass quality gates). Calculate total cost of ownership: (observability bill) + (debugging hours × hourly rate) + (evaluation setup cost). If TCO is decreasing while iteration frequency increases, you chose correctly. If TCO is growing OR if incident detection time is increasing, you've outgrown the platform—consider switching. Review quarterly and adjust based on actual production experience.
Practical field notes from the team building Tracify and operating AI agents in production.
Related posts


Next in the loop
Langfuse vs Tracify: Open-Source Tracing vs Comprehensive Evaluation
Keep reading →