Cost and Latency Monitoring for AI Agents: Keeping Production Systems Efficient
LLM API costs and latency can spiral fast in production. Learn how to monitor, attribute, and optimize the cost and speed of your AI agents using trace data.
Why Cost and Latency Are Production-Critical
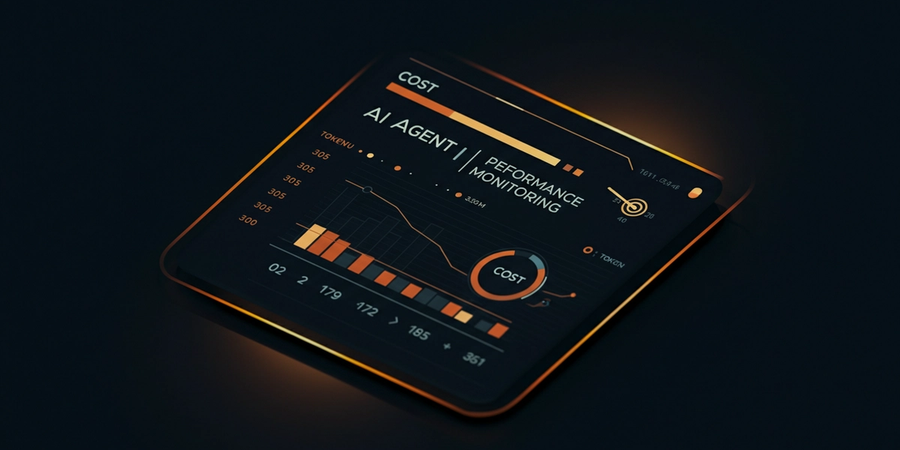
A demo that costs $0.01 per run looks harmless. But at 1,000 runs per hour — a modest production load for a popular AI feature — that becomes $10,000 per day, or $3.6 million per year. Cost and latency are not implementation details to revisit after launch. They are first-class production concerns that determine whether your AI product is economically viable and whether users will actually stick around to use it.
Latency tells a similar story. A 4-second response time feels acceptable during internal testing, when engineers are patient and expectations are low. In production, that same latency breaks the user experience — especially in conversational interfaces where users expect near-instant feedback. Studies consistently show that response times above 2–3 seconds cause significant drop-off in engagement. What you tolerate in a demo, your users will not tolerate in production.
Treating cost and latency as afterthoughts means discovering problems only after they've already hurt your business. The right approach is to instrument them from day one, track them per run, and build alerting before you need it.
Understanding LLM Cost Structure
LLM APIs charge by the token — typically with separate rates for input tokens (the prompt you send) and output tokens (the completion the model returns). Output tokens are almost always more expensive than input tokens, because generating text is computationally heavier than reading it. For example, GPT-4o charges roughly $5 per million input tokens and $15 per million output tokens at current pricing, while GPT-4o mini is an order of magnitude cheaper at around $0.15 and $0.60 respectively.
Model tier differences compound quickly. Claude Opus is a powerful reasoning model but costs significantly more per token than Claude Haiku, which is optimized for speed and economy. Choosing the right model for each task — rather than defaulting to the most capable model everywhere — is one of the highest-leverage cost optimizations available.
In agent workflows, costs compound at every step. A single agent run might involve a planning call, several tool-use calls, a retrieval step, and a final synthesis call — each consuming tokens. If each step averages 2,000 input tokens and 500 output tokens, a five-step agent run already totals 10,000 input and 2,500 output tokens before you've accounted for system prompts, conversation history, or error-recovery retries.
The Token Budget Problem
Agents that reason in long chains or maintain large context windows can consume tokens exponentially. The problem often starts with prompt bloat: system prompts that grow over time as engineers add more instructions, examples, and edge-case handling. A system prompt that started at 500 tokens can easily balloon to 5,000 tokens after a few months of iteration — and that cost is paid on every single LLM call.
Context accumulation is another major driver. Agents that pass the full conversation history into every call see their input token count grow linearly with the number of turns. A 20-turn conversation with 1,000 tokens per turn means the final call receives 20,000 tokens of history — most of which may be irrelevant to the current task.
Thinking in terms of a token budget per agent run helps make these costs concrete. Define a target: for example, a customer support agent should complete its task within 8,000 total tokens. Measure actual usage against that budget in every trace. When runs consistently exceed the budget, investigate which steps are responsible and why.
Measuring Cost per Trace
The foundation of cost monitoring is calculating cost at the span level. Each LLM call span should record three things: the model used, the number of input tokens consumed, and the number of output tokens generated. With those three values and a pricing table, you can compute the exact dollar cost of every individual LLM call in your system.
Rolling span-level costs up to the trace level gives you cost per agent run — the most actionable unit of cost measurement. From there, you can slice by task type to understand which workflows are expensive, by user to identify high-consumption accounts, or by time to spot cost regressions after deployments.
Tracify captures token usage and model metadata at the span level automatically, then aggregates it into per-trace cost summaries. This means you can answer questions like "what does it cost to process one support ticket?" or "which user segment drives the most LLM spend?" without writing custom instrumentation.
Latency Profiling with Traces
Span timing data is the key to understanding where latency comes from. Every span in a trace has a start time and an end time, which means you can see exactly how long each LLM call, tool invocation, or retrieval step took — and how those durations add up to the total trace duration.
Use span timing to identify latency bottlenecks: which LLM call consistently takes the longest, which tool has high p99 latency that inflates tail response times, and where time is spent waiting on external services versus actively processing. Distinguishing waiting time from processing time is especially important — a span that takes 3 seconds because the LLM is generating a long response is very different from one that takes 3 seconds because a database query is slow.
Start by reading your agent traces to build a baseline understanding of where time is actually spent before attempting any optimization. Intuitions about latency are frequently wrong — the bottleneck is rarely where engineers expect it to be.
Common Cost and Latency Culprits
Across many production agent deployments, the same patterns appear repeatedly as the root causes of excessive cost and latency:
- Over-verbose system prompts that include redundant instructions, excessive examples, or outdated context that was never cleaned up.
- Unnecessary re-retrieval in RAG pipelines, where the same documents are fetched on every turn even when the context hasn't changed.
- Using premium models for simple tasks — routing a basic classification or extraction step through GPT-4o when GPT-4o mini or a fine-tuned smaller model would perform equally well.
- Lack of caching for deterministic or near-deterministic calls, where the same prompt is sent repeatedly and the same response is generated at full cost each time.
- Sequential calls that could be parallelized — agent steps that have no dependency on each other but are executed one after another, multiplying latency unnecessarily.
Optimization Strategies
Model routing is one of the most impactful optimizations available. Not every step in an agent workflow requires the most capable model. A planning step that generates a structured task list, a classification step that routes a query to the right handler, or a formatting step that converts output to JSON — these are all candidates for smaller, faster, cheaper models. Implement a routing layer that selects the appropriate model based on task type, and use trace data to validate that quality is maintained.
Prompt compression reduces input token counts without sacrificing task performance. Techniques include removing redundant instructions, replacing verbose examples with concise ones, and summarizing conversation history rather than passing it verbatim. Even a 20% reduction in average prompt length translates directly to a 20% reduction in input token costs.
Output caching stores the results of LLM calls that are likely to be repeated. Semantic caching goes further, matching new prompts to cached responses when they are semantically equivalent even if not identical. Parallelizing independent agent steps — running tool calls or retrieval operations concurrently rather than sequentially — can dramatically reduce wall-clock latency without changing the logic of the workflow. Setting explicit max token limits on output generation prevents runaway completions that inflate both cost and latency.
Always pair optimizations with quality measurement. The risk of evaluating whether optimizations hurt output quality is real — a cheaper model or a compressed prompt might degrade the responses your users receive in ways that aren’t immediately obvious from cost and latency metrics alone.
Setting Alerts and Budgets
Monitoring without alerting is incomplete. Once you have cost and latency data flowing through your observability platform, the next step is defining thresholds that trigger notifications when something goes wrong.
Set per-run cost alerts to catch individual agent runs that consume far more tokens than expected — a sign of prompt injection, runaway loops, or unexpected input sizes. Track daily spend trends to detect gradual cost creep that wouldn't trigger a per-run alert but compounds into significant overspend over weeks. Alert on p95 latency regressions after every deployment, so that a model change or prompt update that degrades tail performance is caught before it affects a large portion of users.
Anomaly detection adds another layer of protection by identifying unusual patterns that don't cross a fixed threshold but deviate significantly from historical baselines. A sudden 3x increase in average token usage might not exceed an absolute limit, but it's a strong signal that something has changed — a new code path, a different user behavior pattern, or a bug that's causing unnecessary retries.
Cost in Multi-Agent Systems
When agents call other agents, cost attribution becomes significantly more complex. A single user-facing request might trigger an orchestrator agent that spawns three sub-agents, each of which makes multiple LLM calls. The total cost of the user request is the sum of all LLM calls across all agents in the chain — but without proper trace propagation, those costs appear as separate, unrelated events.
Multi-agent tracing solves this by propagating trace context across agent boundaries, so that every LLM call made by every sub-agent is linked back to the originating user request. This makes it possible to calculate the true end-to-end cost of a user interaction, identify which sub-agent is the largest cost contributor, and optimize the system holistically rather than in isolation.
Conclusion
Cost and latency are not metrics you can afford to ignore in production AI systems. The economics of LLM APIs mean that small inefficiencies at the span level compound into large expenses at scale, and latency problems that seem minor in testing become user-experience failures in production. The good news is that trace data gives you everything you need to understand, monitor, and optimize both.
By measuring cost at the span level and rolling it up to the trace, you get cost per run, cost per task type, and cost per user. By analyzing span timing, you identify latency bottlenecks and distinguish waiting time from processing time. By setting alerts and budgets, you catch regressions before they become crises. And by applying targeted optimizations — model routing, prompt compression, caching, parallelization — you reduce costs and improve performance without sacrificing quality.
Tracify is built to make all of this straightforward. With automatic token tracking, per-trace cost aggregation, latency profiling, and configurable alerting, it gives ML engineers and product teams the visibility they need to run AI agents efficiently at scale. Try Tracify today and start monitoring the cost and latency of your agents from the very first trace.
Related posts

Stay in the loop
Engineering insights, agent patterns, and production AI from the tracify team. No spam.
Newsletter coming soon. Enter your email to be notified.